


Markets have been roiled by US President Trump’s announcement of strong new tariffs on all trading partners, followed by a 90-day suspension. How this process plays out will be key to the future of the markets over 2025 and probably beyond.
1. The Trump administration is committed to implementing tariffs.
2. The administration is willing to enforce tariffs at levels that match the rhetoric.
I believe this second realization, i.e., the sheer levels of the tariffs the U.S. was willing to enact, was the primary catalyst that caused much of the global equity markets’ sell-off in early April 2025.
The proposed tariff levels are massively uneven among nations, depending on the Trump administration’s view of how specific nations contribute to a trade deficit. Negotiations between world leaders and Trump’s team are happening at a pace that alters the landscape daily.
Top Regulated Brokers
Where We Stand Now
At the time of writing, Trump paused global reciprocal tariffs for 90 days from April 9, with one notable exception: China. His pause followed days of equity and bond markets' sell-off that could have led to a financial meltdown, and the U.S. public would have widely considered Trump responsible in such an event. In my mind, Trump’s team underestimated the market decline and loss of public support that would follow the tariff announcements, hence the abrupt pause.
However, the Trump administration will seemingly continue a baseline 10% tariff on most nations that started on April 5. Had it not been for the extra tariffs and market volatility, this alone would be a headline news item.
The exception for China is stark. Currently, the U.S. has set a 104% tariff on Chinese goods, and China has retaliated with an 84% tariff on U.S. goods—numbers that would have been unthinkable a week ago. The U.S. is in a trade war with China, with neither country wishing to back down, and neither country has an off-ramp. This is uncharted territory for the global economy and the markets.
Trump Really Believes in Tariffs
Trump views tariffs as necessary to bring about the economic change he envisions. This is more than trade deficits for the Trump administration—they have stated a desire to reduce income tax as a source of government revenue and have frequently referenced the late nineteenth century when tariffs were the principal source of government revenue. Income tax became embedded in the US relatively recently in the nation’s history through the 16th Amendment in 1913. I sense that the question is not if tariffs will continue, but how much they will be and when the Trump administration will implement them. Continuing the 10% across-the-board tariff for most nations is a significant step in that direction.
Uncertainty and Instability are Always Bearish
One of the first lessons in economics is that capital is scarce and will flow to more stable regions. Most observers see the back-and-forth whiplash of massive tariffs and sudden retreats as an unstable ecosystem that creates a bearish environment for equities. Quoting Diane Swonk, the chief economist at one of the world’s largest consulting firms, KPMG, “This is nuts. Damage done… Uncertainty is its own tax on the economy.” This atmosphere of uncertainty and instability will weigh heavily on any sustained equity market recovery.
How is the Stock Market Doing?
The S&P 500 sold off heavily from its all-time high on February 19, 2025, declining by nearly 22% before rebounding to recover approximately half the decline. As much as the prospect of tariffs triggered the sell-off, the S&P 500 was already trading at all-time highs and expensive valuations, making the conditions for a sell-off much more likely regardless of what lit the fuse. The principal metric for a stock market’s value is its price-earnings (P/E) ratio. The higher the P/E ratio, the more expensive the market is relative to the companies' profits. The S&P 500’s current P/E ratio is ~27, above its long-term average of ~16. A market with a high historical fundamental value gives it plenty of room to continue falling.
The S&P 500 has high “concentration risk.” Although the index comprises 500 individual companies, the top ten companies account for 35% of its value as of March 31, 2025. Apple, especially, is about 7% of the index, and it is particularly vulnerable to China’s tariffs, given that’s where it manufactures most of its devices. A further decline of just a few of the S&P 500’s top companies will push the value of the index down significantly.
The S&P 500’s high P/E ratio, the uncertainty of this Trump administration, and the continued China tariffs all point towards a bearish fundamental picture, with almost no good news on the horizon to help counter it.
I am always reluctant to be bearish on the S&P 500 because of its long-term bullish track record. However, it has still had moments historically where it went through lengthy bearish markets, and the fundamental conditions seem to be there currently to make it possible. Ultimately, though, I will want the technical picture to confirm that.
The current technical picture for the S&P 500 shows it found significant support at a key technical level when it rebounded on April 9.
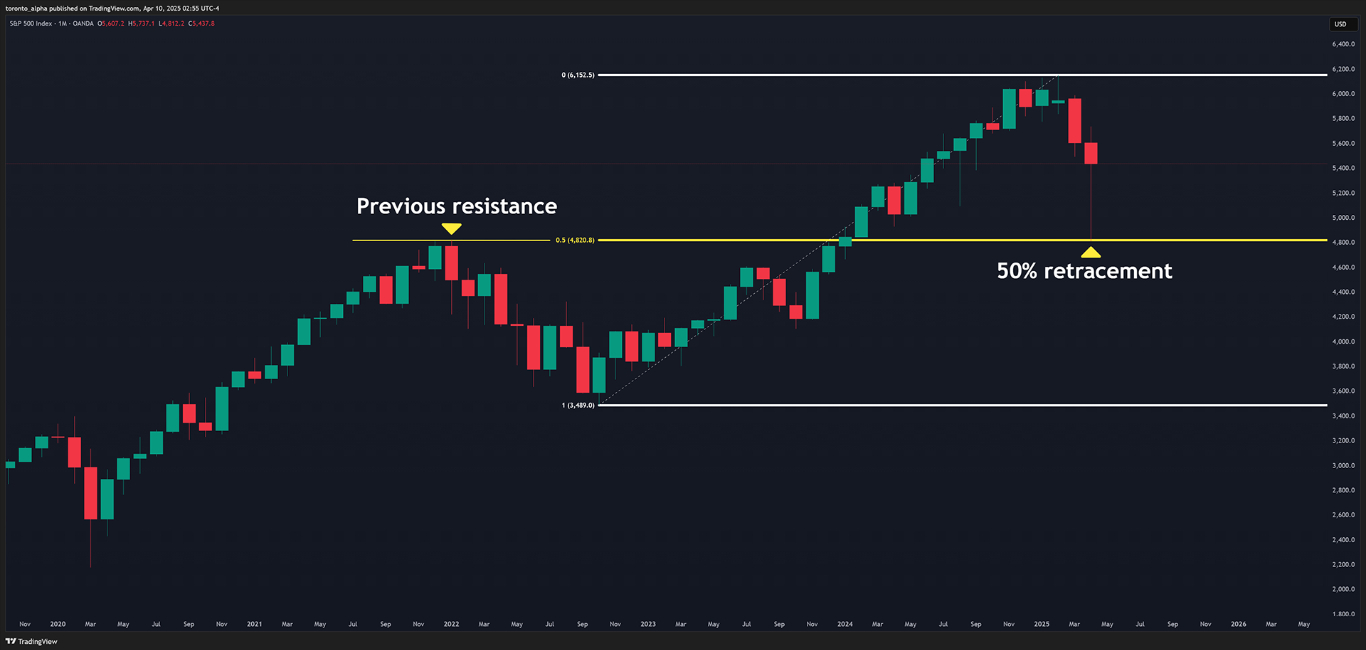
S&P 500 Monthly Chart
Firstly, the index bounced almost precisely at an obvious 50% retracement level. Secondly, this level lined up neatly with a previous resistance level (resistance often turns into support and vice versa). I want this support to be broken and turn into resistance before turning bearish again.
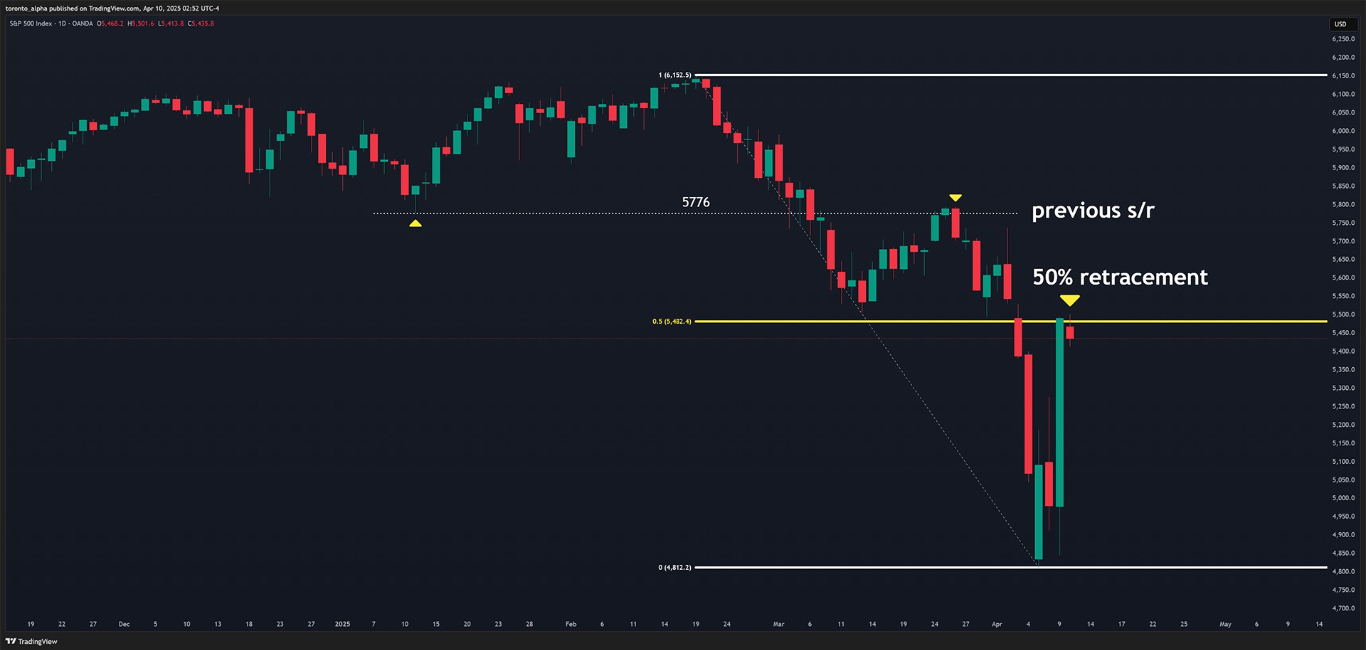
Let’s zoom in on the daily chart to look at the near-term picture.
Interestingly, the market rebound paused at a different 50% retracement level, but only this time, the retracement level acted as a resistance level. I am watching this level, 5482, and a level slightly above it, 5776 (because it was a previous resistance that was a support level), as potential future resistance levels that could hold the price down.
My Take
I firmly believe these moments create opportunities for traders who are switched on and alert to the market environment. In the last several weeks, I’ve seen some of the cleanest support and resistance levels, trends, and chart patterns evolve. Although the events are chaotic, the market liquidity will produce opportunities. It’s our job as traders to capitalize on them. As Winston Churchill once said – “never let a good crisis go to waste”.
Tips for Trading Volatile Markets
Volatility is a good thing for traders. The last thing I want is dead markets with no movement. But high volatility comes with extra risk. Here are some tips:
- Manage risk: always have a stop-loss and take trades with high reward/risk ratios, i.e., don’t risk more than the potential gain in a trade. Sometimes, the stop-loss will have to be wide because of the extra volatility. Pass on the trade if the profit target is less than the stop loss size. Don’t chase the market.
- The markets respect key technical levels even during unexpected geopolitical events. Draw support and resistance levels and look for trends. These are golden opportunities.
- Prepare to take both sides of the market. Be comfortable with being short and long equities. Allow your emotions to remain neutral to the events, and trade what you see, not what you want to happen or what you feel is “right” for the world.
- Look at markets that you usually would not consider. Geopolitical events create winners and losers. You may not have considered trading individual stocks, specific currency pairs, or even commodities before, but geopolitical events can create opportunities in these markets. For example, I’m now looking for trade setups in individual stocks, where before I only focused on indices.