GBP/USD:
The Greenback continues to rally and we are approaching pivotal handles across the G-10. The GBP has been range bound since the end of May, so much so, that it is the worst performing currency against the Dollar amongst the G-10 since May 25th. Currently the 100 day MA is sitting above the 50 day MA which is indicative of a falling price environment.
The Pound is currently trading at 1.6276 and the 50 SMA is sitting at 1.6404. A close below the 50 SMA generates a strong Short entry signal. In addition, using the Fibonacci Retrace from the Cable's low on March 11th at 1.3657 to the Cable's high at 1.7043 on August 5th brings to the forefront some important levels.
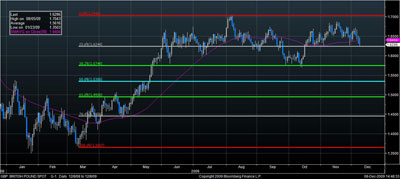
The 23.6% Retrace level sits at 1.6244 just 30 pips from the current mark. The close today likely below the 50 SMA coupled with a breach of the 23.6% level may send the GBP free falling to the next Fibo level of 38.2% or 1.5749.
There are a number of trading indicators that are used for ranging markets versus trending markets. The MACD is a common and important tool for traders as it more easily identifies momentum and changes thereto. In the Chart below the red vertical line highlights the crossover of the Average versus the MACD, representing a shift in momentum.
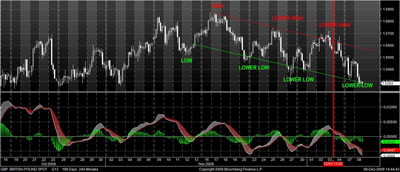
Another indicative technical pattern we use are lower lows, lower highs and vice versa. As you see on the chart above we have been trending down within the range. More importantly we have reached a succession of lower high and lower lows. The more the pattern repeats itself the greater the confirmation of the move and the more likely it is to continue.
The combination of MA's, Fibonacci's, MACD, and technical patterns identifies potential entry points, momentum, and profit targets.