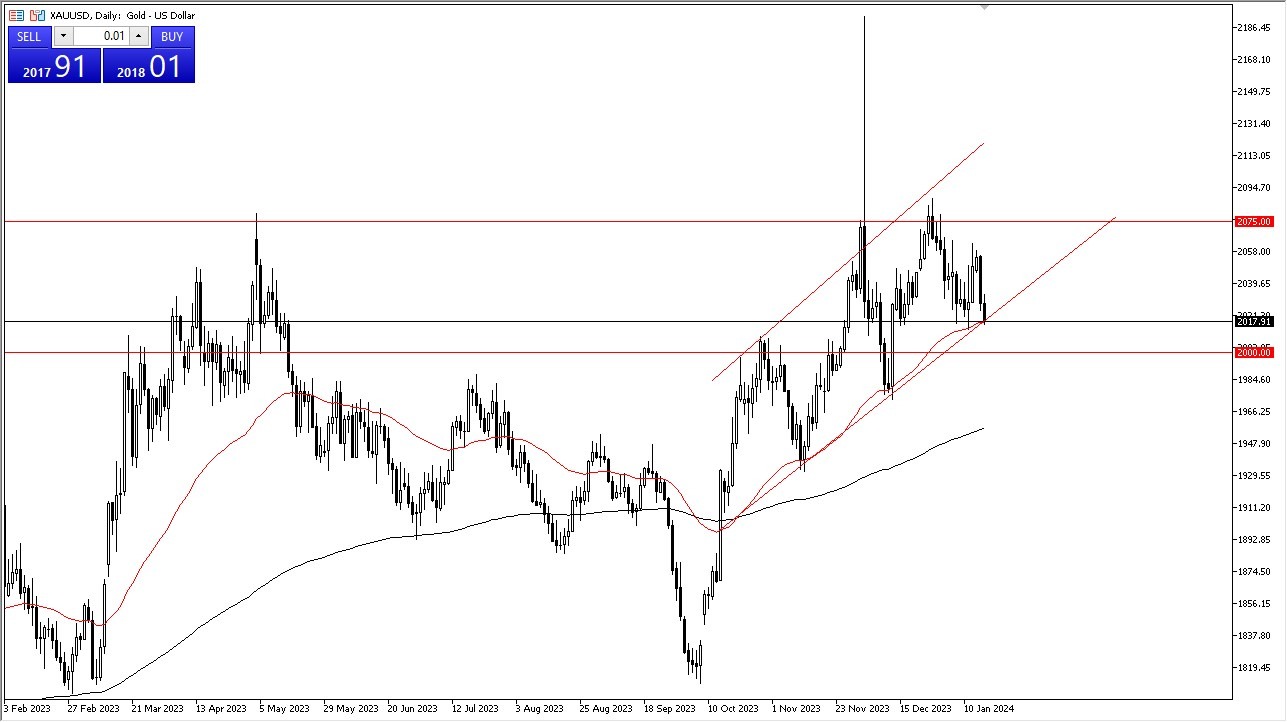
- The gold market experienced an initial decline during Wednesday's trading session, with particular attention drawn to the 50-Day Exponential Moving Average and the underlying uptrend line.

In Wednesday's trading session, the market saw an initial fall, testing both the 50-Day EMA and the underlying uptrend line. However, it subsequently displayed signs of a recovery. Should the market break above the highest point of the candlestick from the session, it is likely to advance towards the $2,050 level. While this level holds significance on short-term charts, it may not be as crucial for longer-term traders, as they tend to focus on the substantial fluctuations that accompany each approach to this level.
It is essential to acknowledge that gold's price dynamics are primarily influenced by the American interest rate market, but geopolitical factors also play a significant role in driving gold prices. If the market successfully surpasses the $2,050 level, the $2,075 level becomes the next point of interest. At this level, prior resistance levels are likely to exert an influence. Breaking beyond this level could potentially herald the onset of a buy-and-hold market.
On the Other Hand…
On the flip side, a break below the 50-Day EMA could trigger a test of the $2,000 level. However, it's important to note that this level is likely to act as substantial support. Maintaining a position above this level suggests a favorable outlook for gold. The possibility exists for gold to continue oscillating within a range bounded by the $2,000 and $2,075 levels.
Top Regulated Brokers
Currently, it appears that buyers are growing increasingly assertive with each market dip. The consistency of the 50-Day EMA's influence over the past few months underscores its reliability. Even if the EMA is breached to the downside, it does not necessarily imply a negative shift in market sentiment. Instead, it could present an opportunity to find even greater value.
Ultimately, the gold market initially witnessed a decline during Wednesday's trading session, emphasizing the importance of the 50-Day EMA and the underlying uptrend line. A potential breakout above the $2,050 level could lead to further gains, while the $2,075 level represents a significant resistance point. Gold's performance is influenced by American interest rates and geopolitical factors. Maintaining a position above $2,000 is key for a positive outlook, and the market may continue to fluctuate within the $2,000 to $2,075 range. Buyer confidence appears to be strengthening with each dip, highlighting the ongoing influence of the 50-Day EMA. Even a breach of the EMA does not necessarily signal a shift in overall market sentiment but could offer opportunities to identify increased value.
Ready to trade today’s Gold forecast? Here are the best Gold brokers to choose from.
