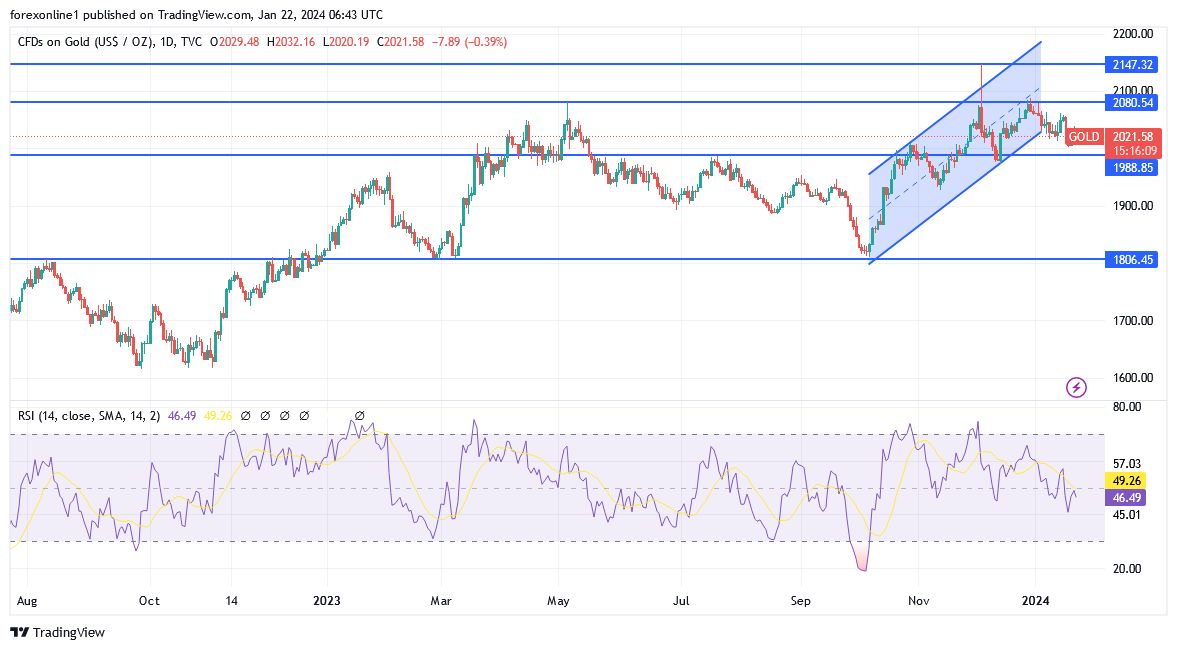
- With the start of trading this week, the price of gold XAU/USD is giving up its gains at the end of last week, which reached the resistance level of 2040 USD per ounce, with losses extending to the support level of 2020 USD per ounce, which is stable around it at the time of writing the analysis.
- Moreover, the decline in the pace of investors' interest in buying safe havens contributed to the current selling. Shortly, as we mentioned, gold will remain in a strong position.

In general, the recent rise in gold that has reached record levels continues to rise in a balanced manner. However, the strong technical factors for gold have not yet attracted investors back, and demand for investing in gold seems to have stalled. Very little capital has been allocated to ride this rise, which is quite unusual. Moreover, this dangerous disconnect will not last, eventually the price of gold will rise enough for long enough to reappear on investors' radars. Then they will rush back to chase it.
Ultimately, Gold suffered a heavy blow last week, suffering a decline of 1.0% on a consecutive basis. Tuesday's loss came after the Fed governor spoke toughly about keeping US interest rates high for a longer period in 2024. Wednesday's loss came after US retail sales came stronger than expected in December, which lowered the chances of a Fed rate cut. Therefore, Both led to buying of the US dollar, leading to large sales of gold futures, which pushed the price of gold down again to around 2006 USD.
This sharp decline in gold has weighed on sentiment, leaving a bearish trend burning in its wake. But as is always the case in the markets, daily volatility should be viewed within a broader context. Gold is still strong, with highly bullish technicals. Its recent rally in early October increased by as much as 14.2% in the best case over 2.7 months until late December. Also, this race had achieved the first new nominal record levels for gold in several years!
Technically, nearly $2,004 in the middle of last week, gold's overall decline from its recent record extended to only 3.4%. Gold was near the 50-day moving average, which often acts as support in sustained rallies. Overall, gold performs well against the benchmark US Dollar Index, which drives gold futures trading. At 103.4, the US Dollar Index bounced back to pre-FOMC levels in December. The last time it reached this high, the price of gold was less than $1,980 an ounce.
Top Regulated Brokers
While speculators care, investors don't seem to care. The global gold investment market is somewhat opaque, as final supply and demand data are only published once a quarter by the World Gold Council. Obviously, the excellent quarterly gold demand trends reports are highly anticipated and provide the best available read on global gold fundamentals. Also, the new fourth quarter of previous year release, will likely be published at the dawn of February.
In general, investment demand in gold is divided into two subcategories: traditional bullion and coins and gold exchange-traded funds. The former was flat, falling by just 1.1% or 10.0 tons in the first 3/4 of last year. But demand for gold bullion from physically backed ETFs collapsed from -20.3t in the first few quarters of 2022 to -189.0t in 2023! This represents 168.7 tons or 94% of the annual decline in investment demand for gold since the beginning of the year!
As gold ETFs have proven to be a dominant force driving gold prices over the past decade, these quarterly GDT reports also track the world's largest physically backed ETFs. Two US giants, GLD SPDR Gold Shares and IAU iShares Gold Trust ETFs, have always topped this list. At the end of Q3, they together held more than 39% of the total gold held by virtually all backed ETFs in the world!
Finally, these powerful gold ETFs are playing increasingly important roles in the global gold market, serving as conduits for large pools of US equity investor capital into and out of physical gold bullion.
Gold Price Forecast and Analysis Today:
Looking at the daily chart of gold price XAU/USD, it is clear that the head-and-shoulders pattern is forming, which technically supported the recent selling of gold. However, the overall trend is still bullish in general. Therefore, if the gold price returns to the support levels of 2000 and 1985 USD, respectively, it will stimulate investors to consider buying gold again. Moreover, buying gold from all downward levels as global geopolitical tensions remain a strong and important support for the gold market. On the other hand, and on the same time period, the return of gold to the resistance levels of 2055 and 2070 USD per ounce will be important for the strength of the bulls' control over the trend.
Ready to trade our Gold forecast? We’ve shortlisted the most trusted Gold brokers in the industry for you.
