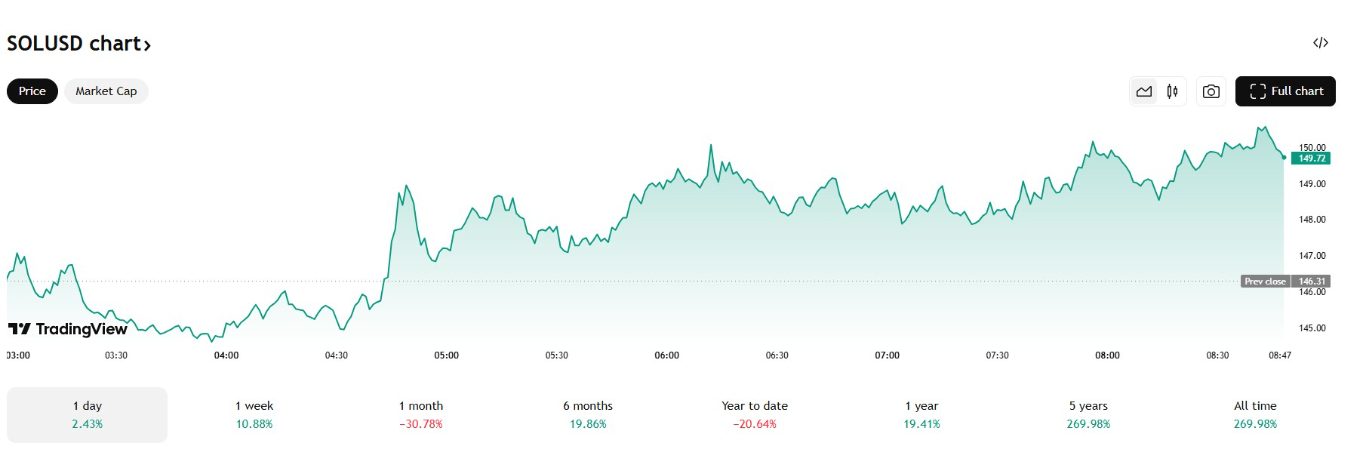
Solana Price Eyes Stabilization

Solana Price | Source: TradingView
Solana’s price has faced intense selling pressure over the past few weeks, falling from the $210 region to test critical support near $150. This area previously served as a launchpad for the late-2023 rally and has attracted some buying interest.
A low was formed near $149.50, and SOL recently started a minor recovery, reclaiming levels above $155. The price moved past the 23.6% Fib retracement of the recent down move from the $210 swing high to the $149.50 low.
However, SOL/USD remains below both the 50-day SMA (near $175) and the 200-day SMA (near $185), highlighting that the broader trend is still bearish.
Top Regulated Brokers
On-Chain Activity Signals Mixed Sentiment
Solana’s perpetual futures funding rates have flipped slightly negatively, showing that short sellers are still in control. This reflects lingering bearish sentiment in the derivatives market, where traders are either betting on lower prices or hedging existing long positions.
At the same time, on-chain data reveals whale accumulation near the $150 level, meaning some large holders are seeing value at current prices. This type of buying at strong technical support can signal confidence among long-term holders, even if short-term sentiment remains cautious.
Active address counts on the Solana network have declined from recent highs, but the network still maintains a higher base level of users compared to many other Layer-1 chains. This suggests that Solana’s core ecosystem is holding steady, even as speculative activity cools off.
Trendline and Fib Resistance Ahead
As Solana tries to build a recovery, the first real test lies near $164, which aligns with the 38.2% Fibonacci retracement from the $210 high. More importantly, there’s a descending trendline near $170, which has capped previous bounce attempts. This makes $170 a critical short-term barrier.
If SOL can clear $170, the next upside target sits at $180, right where the 50-day SMA and the 50% retracement converge. A decisive break and close above $180 would shift momentum in favor of bulls, with the door reopening for a push toward the psychologically important $200 level.
RSI and MACD Signals
- 4-hour RSI: The Relative Strength Index is currently hovering near 54, just above the midline, indicating relatively bullish momentum.
- Daily MACD: The MACD remains in bearish territory but shows signs of a potential crossover, hinting at weakening downside momentum.
What’s Next for Solana: Key Levels to Watch
Solana’s next major move hinges on how price reacts around $150, which is the critical support that has repeatedly attracted buyers.
In a bullish scenario, Solana holds above $150, builds upward momentum, and pushes back toward $170 where a key trendline resistance stands. Clearing $170 would open the door to a test of $180, with further upside toward $200 if momentum holds.
A decisive break above $200 could trigger a broader recovery, with upside targets at $210 (the last swing high), followed by $225 and $250, with a stretch target near $260–$265, where Solana previously peaked.
On the flip side, failure to reclaim $170 or worse, a confirmed close below $150 would shift momentum firmly back to the sellers. That breakdown could quickly drive Solana into the $138–$140 zone, which aligns with a major demand area and the 78.6% Fibonacci retracement of the previous rally.
If that fails to hold, $130 comes into focus as the next major floor, with deeper downside risk extending toward $120 and even $109, a level that analysts have flagged before based on historical price action.
Ready to trade daily forecast? Here are the best MT4 crypto brokers to choose from
