Bearish view
- Sell the BTC/USD pair and set a take-profit at 70,000.
- Add a stop-loss at 80,000.
- Timeline: 1-2 days.
Bullish view
- Buy the BTC/USD pair and set a take-profit at 80,000.
- Add a stop-loss at 70,000.

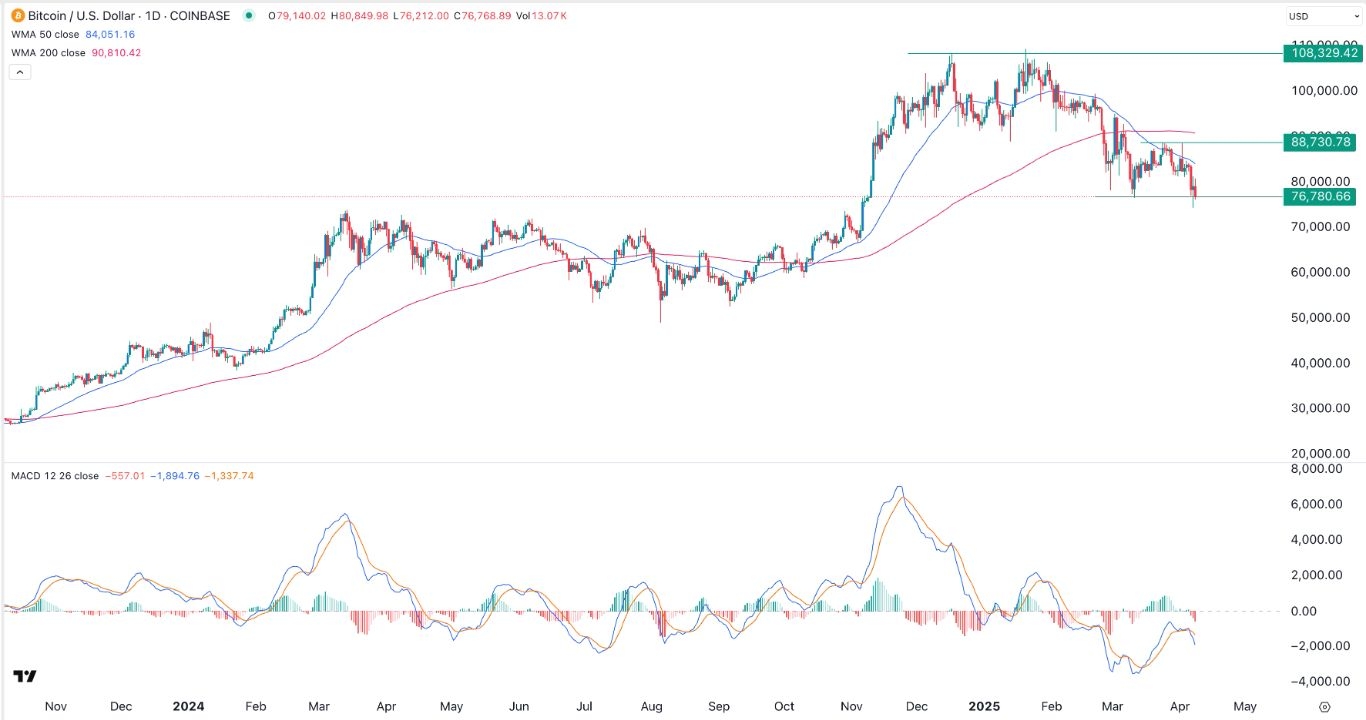
The BTC/USD pair continued its recent downtrend as the US and China trade conflict accelerated, leading to higher recession risks. Bitcoin price dropped to $76,800 on Wednesday, much lower than the year-to-date high of $109,300.
China and US trade conflict accelerates
The BTC/USD pair remained under pressure as the two biggest economies continued their trade conflict. Donald Trump has ratcheted his trade rhetoric, a week after he announced his Liberation Day tariffs.
He announced that the US would charge China a 34% tariff on top of the 20% he implemented a few weeks before. China retaliated against these tariffs by applying a 34% tariff on most goods from the US.
The trade war escalated on Wednesday as Trump boosted his tariffs against China by 50%. This means that goods from China are being charged as high as 104%, a move that will make it impossible for trade between the two countries.
Analysts believe that the continued trade war will lead to a recession, which will hurt people in the US, China, and other countries. Goldman Sachs, JPMorgan, and Citi analysts have recently boosted their odds for a US recession.
Top Regulated Brokers
However, historically, Trump starts his negotiations at a riduculous level and then narrows down over time.
The next important catalyst for the BTC/USD pair will be the upcoming FOMC minutes, which will provide more information about the last meeting. While this FOMC minute report and Thursday’s inflation data are important, analysts expect that their impact will be limited because the world has changed in the past few days.
BTC/USD technical analysis
The daily chart shows that the price of Bitcoin has slumped in the past few weeks. It has dropped from the year-to-date high if $109,200 to a low of $76,700, its lowest level in months. The BTC/USD pair has formed a death cross pattern as the 50-day and 200-day moving average crossed each other.
The pair has also invalidated the double-bottom pattern at 76,780. This pattern is made up of two down-peaks and a neckline, which, in this case is at 88,730. The Relative Strength Index (RSI) and the MACD indicators have continued falling.
Therefore, the BTC/USD pair will lkely continue falling, with the initial target at 70,000. More downside will be confirmed if ot moves above the resistance at 85,000.
Ready to trade our free trading signals? We’ve made a list of the best Forex crypto brokers worth trading with.
