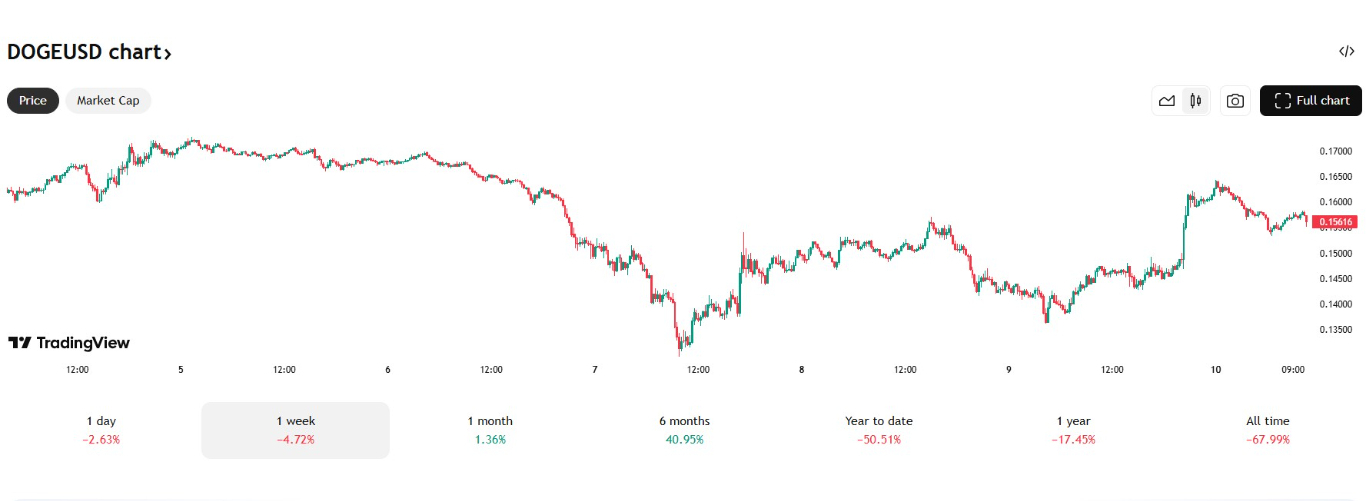
DOGE Price Stalls Below Key Resistance

Price Chart | Source: TradingView
DOGE attempted a push past the $0.16 resistance zone but failed to hold above that level. The rejection triggered a retracement toward the $0.15 mark, with intraday lows touching $0.1436. This minor drop is part of a larger descending channel structure that’s been forming over the last few weeks.
Adding to the pressure, whale activity has surged. On-chain data shows that approximately 1.32 billion DOGE were moved to exchanges over the past 48 hours, suggesting potential sell-offs by major players.
Such whale behavior has historically preceded short-term price drops, and this instance appears to be no exception.
Key Indicators Point to Cautious Momentum
Technical indicators paint a mixed but increasingly cautious picture for Dogecoin. The Relative Strength Index (RSI) currently hovers around 59 on the daily chart, approaching overbought territory but still in a neutral zone.
This implies that while buyers are active, momentum has not yet tipped into a breakout scenario.
Meanwhile, DOGE is trading below both its 50-day and 200-day moving averages. The 50-day MA currently stands at $0.1928, while the longer-term 200-day MA sits significantly higher at $0.2482.
These positions signal that the current trend is still broadly bearish, despite short-term bullish attempts. For any sustained rally to occur, DOGE will need to decisively reclaim these moving averages with strong volume support.
The Moving Average Convergence Divergence (MACD), however, offers a glimmer of hope. With the MACD line positioned above the signal line, there is a mild bullish crossover—often an early sign of trend reversal if confirmed by price action.
Support and Resistance Levels to Watch
For traders and analysts watching DOGE, the current price zone is critical. Immediate support lies around $0.14, a level that has previously acted as a floor for price rebounds. A breakdown below this level could open the door to further declines, potentially revisiting the $0.12 and $0.10 regions.
On the flip side, a clean break above $0.16 would be a strong bullish signal, opening the path toward $0.20—an area of historical resistance that previously acted as support during late 2024. Further up, $0.25 and $0.30 represent stronger resistance levels that bulls would need to conquer for any long-term reversal to materialize.
Traders should also note the descending channel pattern on the daily chart. If DOGE can close above the upper trendline of this channel with significant volume, it could indicate a breakout and the beginning of a new uptrend.
On the other hand, a breakdown below the channel’s lower boundary could trigger a wave of selling and further bearish momentum.
Final Thoughts
Dogecoin is at a critical technical juncture. After failing to clear the $0.16 resistance zone, the price has slipped back into a tight trading range, with $0.14 acting as key support.
The next few days could determine DOGE’s short-term direction: a breakout above resistance could set the stage for a run toward $0.20 and beyond, while failure to hold the current support may lead to further losses.
