
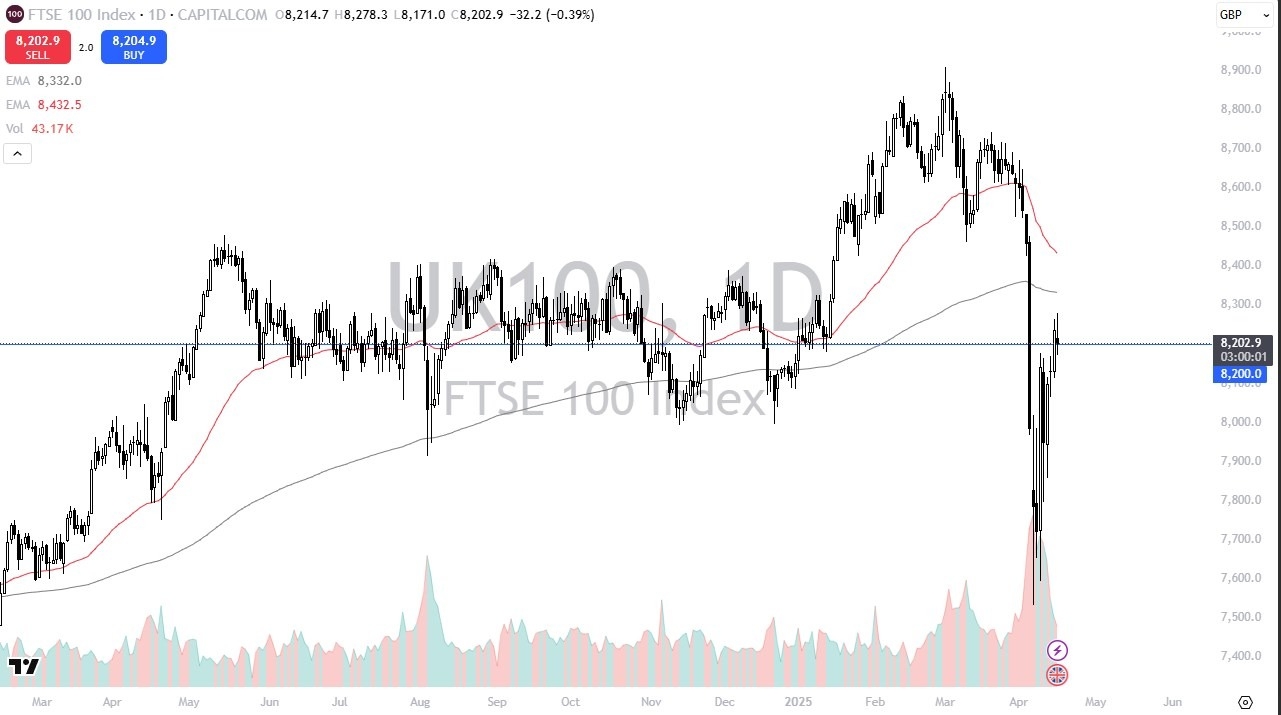
- The FTSE 100 has gone back and forth during the trading session on Wednesday, as we find ourselves hanging around the 8200 level.
- This is an area that obviously is a large, round, psychologically significant figure, and an area that has been previously support. In other words, there should be a certain amount of “market memory” in this general vicinity.
- With that in mind, I do not find the fact that the market couldn’t break above here as particularly surprising, because quite frankly we had gotten a little stretched from the bounce.
Technical Analysis and Trend
The technical analysis for this market is almost solely dependent on whether or not you are talking about short or long-term time frames, but I think ultimately this is a situation where we are about to make some kind of decision as to where we are going longer term. If we break down below the 8100 level, it’s likely that this market will continue to drop, perhaps down to the 7800 level. On the other hand, if we rally from here and break above the 8300 level, then I think we take out the 200 Day EMA, and continue to go higher.
Top Regulated Brokers
The candlestick is of course neutral, so with that being said it does make a certain amount of sense that traders will wait to see which direction we break, and it’s probably worth noting that Friday is Good Friday, and that will capture a certain amount of attention in and of itself. With Friday being Good Friday, this is more or less a situation where we need to reflect and start to think about where we are going longer term. After all, there is a lot of confusion out there, and the trend is a bit of a mixed bag at the moment.
By letting the market tell you which direction it wants to go, you can perhaps increase the odds of your success. With the erratic behavior that we have seen in various markets, it does make a certain amount of sense to be cautious, despite the fact that the United Kingdom itself isn’t necessarily one of the worst places to be invested in.
Potential signal: The FTSE 100 is setting up a “50-50 trade.” This is when I am either a buyer or seller, depending on which side of the neutral candle we break. I would be aiming for the length of the candlestick as a target and setting my stop loss in the middle of it. Use the Asian rollover (12am GMT) to measure the candle.
Ready to trade our stock market forecast and analysis? Here are the best CFD stocks brokers to choose from.