
SOL Price Rallies Back Above $130
After dropping to an intra-day low of $123.67, Solana staged a sharp recovery later, pushing to a 24-hour high of $133.56.
It is currently trading at about $133.07, representing a nearly 2% gain in the past 24 hours and 12% over the last week.
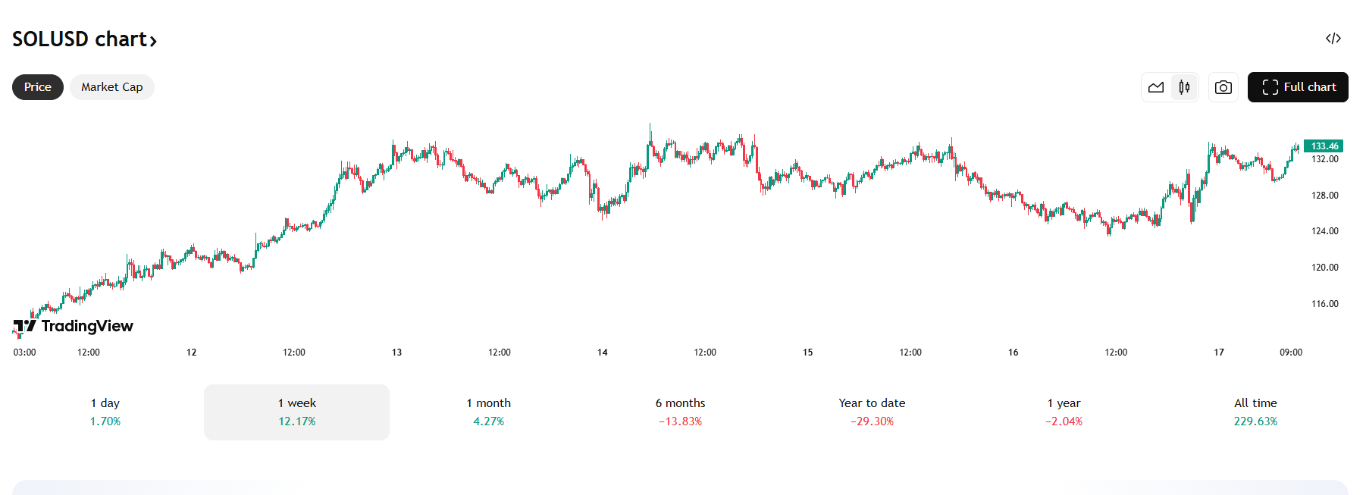
Solana Price Chart | Source: TradingView
This bounce has lifted SOL above both the 50-day and 200-day exponential moving averages, which sit at $129.51 and $125.59, respectively, an encouraging signal for mid-term momentum.
More importantly, Solana’s price now sits in a historically significant range that has previously acted as both support and resistance. The current recovery above $130 may signal a trend shift, but that level remains a critical zone that could swing either way.
Momentum is Building, But Not Yet Convincing
Momentum indicators reflect a cautiously optimistic picture. The Relative Strength Index (RSI) currently stands at 60.99, which suggests bullish momentum is building.
However, it hasn’t yet entered overbought territory, meaning there could still be room for upside before a correction becomes likely.
Meanwhile, the MACD (Moving Average Convergence Divergence) is at +0.992. This places it firmly in bullish territory, signaling a continuation of the current uptrend—at least in the short term.
However, not all signals are as strong. The Average Directional Index (ADX), a technical tool used to measure the strength of a trend, currently sits at just 15.42. Typically, values under 20 suggest that a trend lacks strong conviction.
In Solana’s case, this indicates that while the price action is leaning bullish, the overall strength behind the move remains weak.
Top Regulated Brokers
Whales Are Watching This Level
The $130 level isn’t just psychologically significant—it’s also a major on-chain price cluster. Analysts have noted that more than 32 million SOL, roughly 5% of the token’s circulating supply, was accumulated in this range.
This establishes $130 as a high-volume node, an area where many market participants have previously shown strong interest.
If bulls manage to hold above this level and push beyond $135, the $130 zone could flip into a sturdy support level.
On the other hand, failure to maintain this level could result in renewed selling pressure, dragging prices lower.
What to Watch Out For
Should momentum continue, the first upside target for Solana is the $138 to $140 range. A confirmed daily close above this zone would mark a key breakout and may pave the way for a move toward $152, which was a notable resistance level during March’s rally.
If buyers remain in control, further gains could push SOL toward $160. That would represent a significant technical breakout and could spark a fresh wave of investor interest.
Should the bullish momentum accelerate, a long-term target could emerge around $178—just before the psychological $200 mark comes back into focus.
Despite the recent strength, Solana’s bullish structure could quickly unravel if $130 fails to hold.
The first key support lies at $125, which is reinforced by the 200-day EMA. A breakdown below this level would signal weakness and potentially spark a correction toward $120. If that level also fails to hold, the next zone of interest would be in the $112 to $115 range.
Below that, Solana could revisit $108—an area that previously attracted significant demand. Any sharp breakdown from here would likely shift market sentiment once again, in a bearish direction.
Ready to trade our daily Forex signals on Bitcoin? Here’s our list of the best MT4 crypto brokers worth reviewing.