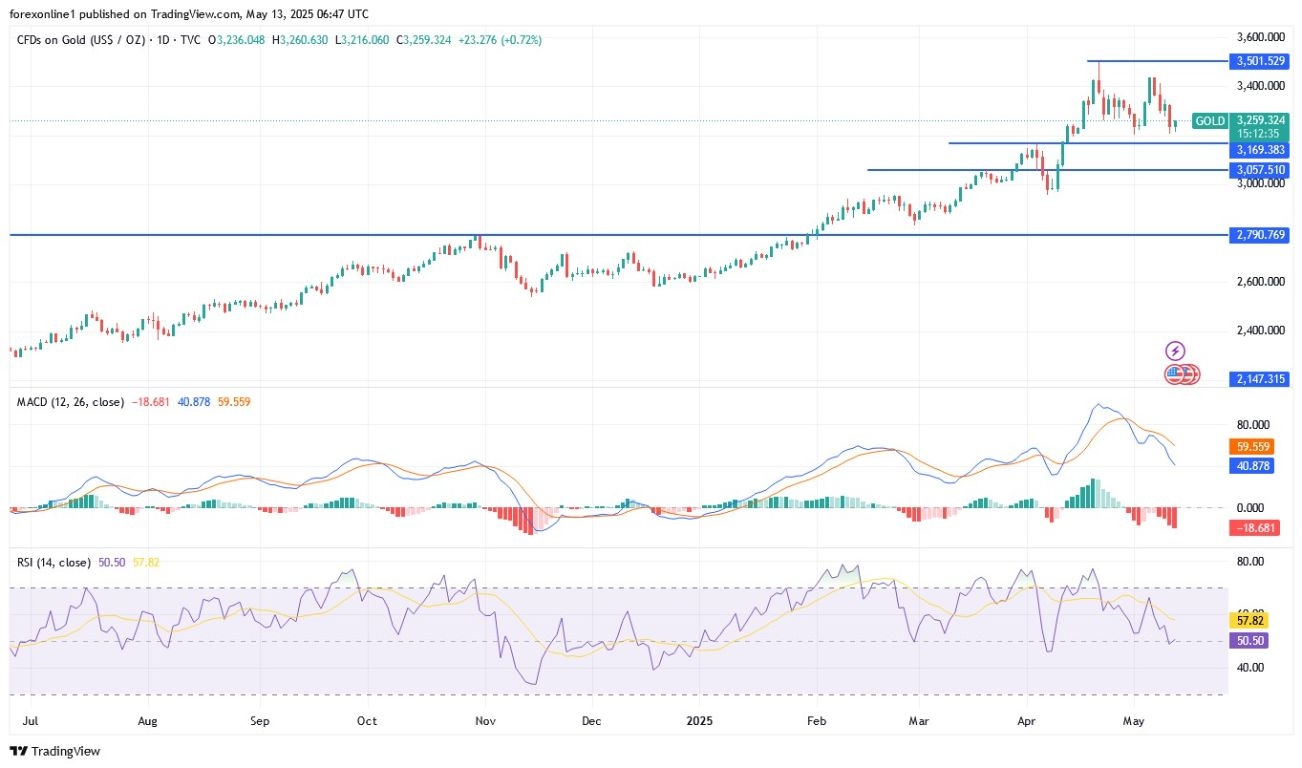
Today’s Gold Analysis Overview:
- The Overall Trend for Gold: Bearish.
- Today's Gold Support Levels: $3200 – $3170 – $3120 per ounce.
- Today's Gold Resistance Levels: $3270 – $3330 – $3380 per ounce.

Today's gold trading signals update:
- Sell gold from the resistance level of $3,300, with a target of $3,140 and a stop loss of $3,370.
- Buy gold from the support level of $3,165, with a target of $3,300 and a stop loss of $3,100.
Technical Analysis of Gold Price (XAU/USD) Today:
At the start of trading this important week, spot gold prices plummeted by more than 3 percent, with losses extending to the $3208 per ounce support level, falling from the session's high at the $3326 per ounce resistance level. The gold price index is stabilizing around the $3235 per ounce level at the time of writing this analysis. Selling pressure on gold bullion increased amidst the strength of the US dollar in the markets due to easing tensions following a US/China announcement of reaching trade agreements that may prevent a global economic recession.
According to gold trading platforms, gold prices fell to their lowest level in about a month, amid improved investor sentiment and declining demand for gold as a safe haven following news of a significant rollback of tariffs by the United States and China.
After trade negotiations in Switzerland over the weekend, the United States announced that it would cut tariffs on Chinese goods from 145% to 30%, while China would lower tariffs on US imports from 125% to 10%, both for a 90-day period. This move represents a significant de-escalation in the trade war and indicates a mutual willingness to seek a settlement instead of continued confrontation. Market optimism was also supported by a ceasefire between India and Pakistan, which remains in place despite ongoing accusations of violations by both sides.
Top Regulated Brokers
Trading Advice:
We still advise buying gold from every downward level without risk and distributing trading positions across several levels while monitoring the factors affecting the gold market.
Meanwhile, the non-yielding gold market faced additional pressure after the US Federal Reserve recently warned of rising inflation and labor market risks, with Fed Governor Jerome Powell ruling out a pre-emptive cut in US interest rates in response to tariff-related uncertainty.
Technical Levels for Upcoming Gold Prices:
According to trading on the daily timeframe chart, if spot gold prices move to break the $3200 per ounce support, gold analysts' expectations for further downward movement may increase, moving towards the support levels of $3200, $3165, and $3090 per ounce, respectively. Until the move towards the support, the 14-day Relative Strength Index (RSI) is moving to break the midline, confirming the strength of the bearish shift in gold prices. At the same time, according to the MACD indicator lines, the blue line precedes the orange line, which supports the bears to move strongly downwards. In general, the technical indicators have more time and space before moving towards the oversold zone. On this timeframe and the bearish outlook, the most prominent current gold support levels will be $3200, $3165, and $3090 per ounce, respectively.
According to the bullish scenario for gold prices, on the daily chart, this will happen if the bulls succeed in pushing gold prices towards and above the $3300 per ounce resistance. In general, dear gold trader, be a good observer. Global trade and geopolitical tensions and global central bank purchases of gold will remain the most prominent positive catalysts for the gold bullion market. On another front, US inflation reading will be announced today at 3:30 PM Egypt time, which in turn will affect market expectations for the future policies of the US Federal Reserve and the US dollar price, and consequently the gold market.
Ready to trade today’s Gold forecast? Here are the best Gold brokers to choose from.
