Bearish view
- Sell the GBP/USD pair and set a take-profit at 1.3315.
- Add a stop-loss at 1.3700.
- Timeline: 1-2 days.
Bullish view
- Buy the GBP/USD pair and set a take-profit at 1.3700.
- Add a stop-loss at 1.3315.

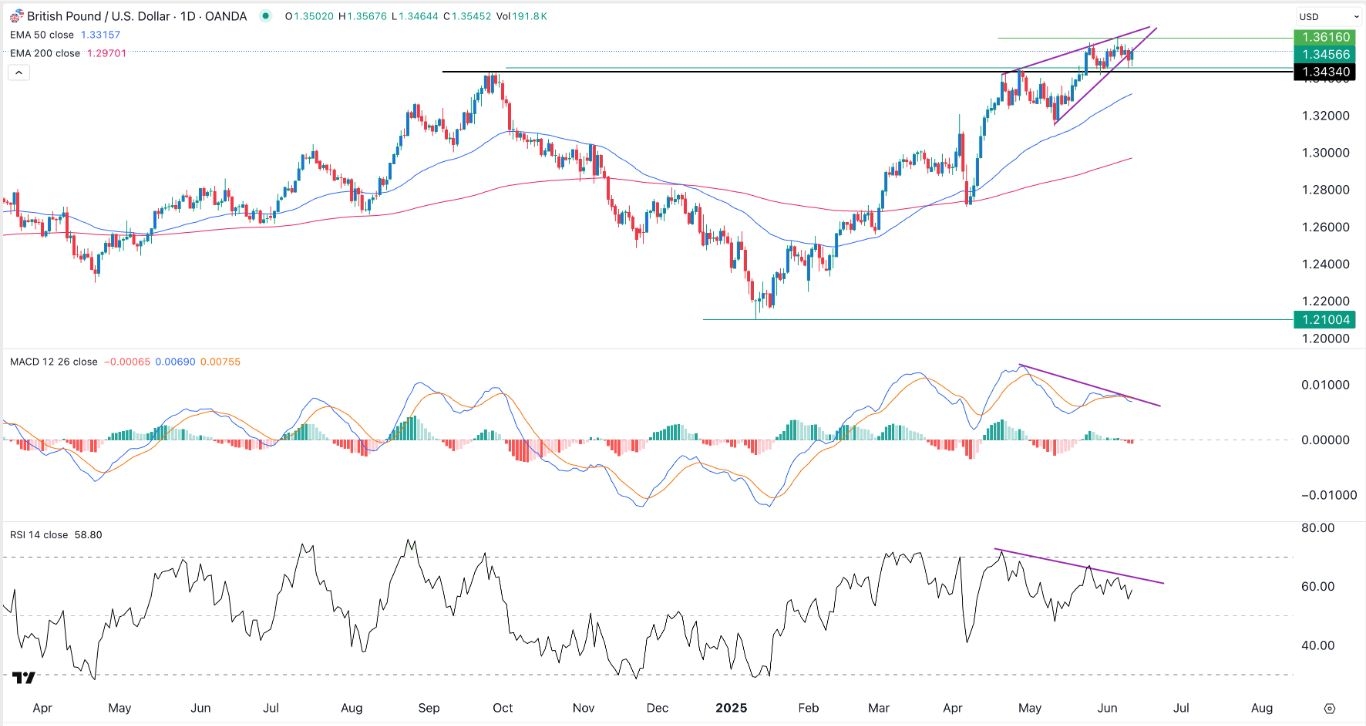
The GBP/USD exchange rate held steady as the US dollar index fell after the US published softer inflation data. It rose to 1.3555 on Thursday, a few points below the year-to-date high of 1.3616.
US inflation and UK GDP data
The GBP/USD exchange rate rose after the US published the latest inflation data. Bureau of Labor Statistics data showed that the headline consumer inflation rose from 2.3% in April to 2.4% in May, while the core CPI remained at 2.8%.
These numbers were softer than analysts expected because of Donald Trump’s tariffs. A likely reason is that companies still had inventory that they accumulated before the Liberation Day tariffs.
Top Regulated Brokers
Looking ahead, the US will publish the latest producer price index (PPI) data and initial and continuing jobless claims data on Thursday.
The GBP/USD pair also drifted upwards after the trade talks between the US and China ended. The two sides agreed to end the recent hostilities as China used its grip of the rare earth materials to squeeze the US. A truce will lower tensions that have been simmering in the past few months.
The next key GBP/USD news will come out today, June 12, when the UK publishes key April economic data. Economists expect the data to show that the economy contracted by 0.1% in April after it expanded by 0.2% in March.
They also expect the report to show that industrial and manufacturing production contracted during the month. If these numbers are correct, it means that the Bank of England will likely cut interest rates in this month’s meeting.
GBP/USD technical analysis
The daily chart shows that the GBP/USD pair has been under pressure in the past few days. This performance happened after the pair formed a rising wedge pattern, a popular bearish reversal sign. A wedge happens when an asset forms two ascending and converging trendlines.
The Relative Strength Index (RSI) and the MACD indicators have formed a bearish divergence pattern. This divergence happens when oscillators are falling as an asset remains in an uptrend.
Therefore, the pair will likely retreat and possibly retest the 50-day Exponential Moving Average (EMA) at 1.3315. A move above the year-to-date high of 1.3615 will invalidate the bearish view.
Ready to trade our free daily Forex trading signals? We’ve shortlisted the best UK forex brokers in the industry for you.
