
Short Trade Idea
Enter your short position between 107.34 (yesterday’s intra-day low) and 108.71 (yesterday’s intra-day high).
Market Index Analysis
- AFLAC (AFL) is a member of the S&P 500
- This index trades near record highs, with average bearish volumes higher than bullish ones
- The Bull Bear Power Indicator of the S&P 500 shows a negative divergence
Market Sentiment Analysis
President Trump has threatened China with tariffs of up to 200% if it restricts the export of magnets to the US. He also touted higher leverage in trade negotiations by withholding Boeing parts, claiming over 200 aircraft were unable to fly due to his actions. He added that countries that levy digital taxes on US companies would face stiff tariffs and export restrictions on US chips. Finally, he told US Federal Reserve Governor Cook that he fired her, but she stated that he lacks the authority to do so. Bearish sentiment is likely to dominate today and extend losses.
AFLAC Fundamental Analysis
AFLAC is the largest provider of supplemental insurance in the US. It is best known for its payroll deduction insurance coverage and was a pioneer in cancer insurance, introducing it in 1958. The AFLAC Duck is a well-recognized mascot.
So, why am I bearish on AFL despite its post-earnings rally?
AFLAC struggles with declining revenues, but the destruction of shareholder value flashes a more notable red flag. While its Japanese Miraito cancer insurance product drives growth, sluggish US sales and downbeat future expectations will overshadow the bright spot Japan provides. AFLAC noted plans for a digital transformation, but that it would take its time due to a favorable yield curve on its corporate cash reserves. Therefore, I think AFLAC could fall further behind its competitors in the US.
AFLAC Fundamental Analysis Snapshot
Metric | Value | Verdict |
P/E Ratio | 24.24 | Bullish |
P/B Ratio | 2.11 | Bullish |
PEG Ratio | Unavailable | Bearish |
Current Ratio | Unavailable | Bearish |
ROIC-WACC Ratio | Negative | Bearish |
The price-to-earnings (P/E) ratio of 24.24 makes AFL an inexpensive stock. By comparison, the P/E ratio for the S&P 500 is 29.84.
The average analyst price target for AFL is 108.08. It suggests no upside potential, while downside risks are rising.
AFLAC Technical Analysis
Today’s AFL Signal
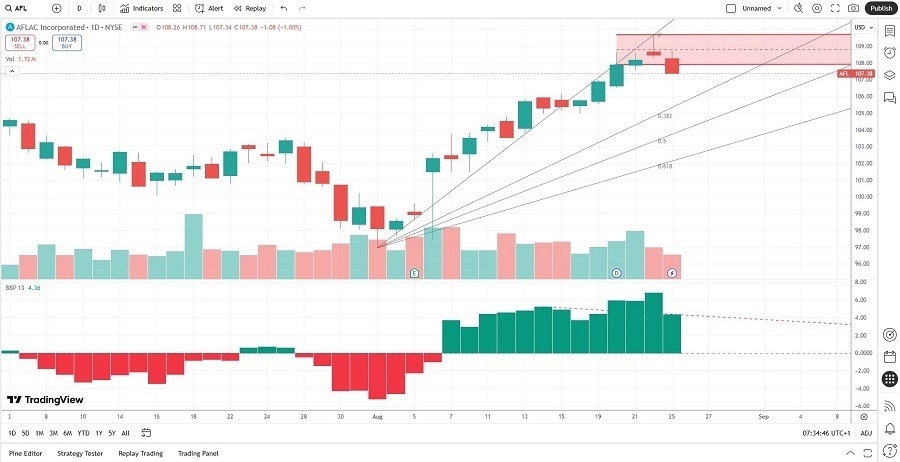
- The AFL D1 chart shows a price action breakdown below its horizontal resistance zone
- It also reflects price action approaching its ascending 38.2% Fibonacci Retracement Fan levels
- The Bull Bear Power Indicator is bullish but shows a negative divergence
- The average bearish trading volumes are higher than the average bullish trading volumes during its post-earnings rally
- AFL advanced with the S&P 500, but bearish signals have overtaken bullish factors
My Call
Top Regulated Brokers
I am taking a short position in AFL between 107.34 and 108.71. Shareholder value destruction, a lack of future vision, sluggish US sales, and no upside potential based on the average analyst price target make this company a sell in my portfolio.
- AFL Entry Level: Between 107.34 and 108.71
- AFL Take Profit: Between 95.97 and 96.95
- AFL Stop Loss: Between 111.30 and 112.96
- Risk/Reward Ratio: 2.87
Ready to trade our free daily signals? Here is our list of the best brokers for trading worth checking out.