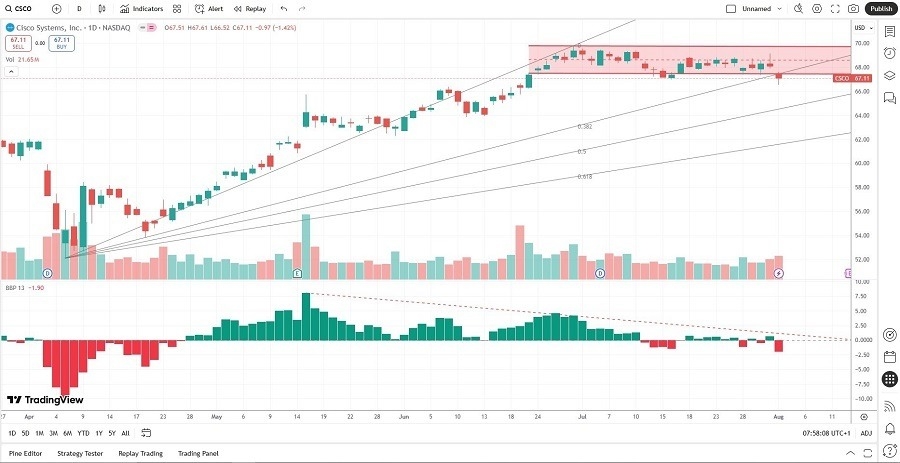
Short Trade Idea
Enter your short position between 66.52 (Friday’s intra-day low) and 67.49 (the lower band of its horizontal resistance zone).
Market Index Analysis
- Cisco Systems (CSCO) is a member of the NASDAQ 100 Index, the Dow Jones Industrial Average, the S&P 100 Index, and the S&P 500 Index.
- All indices have retreated from record highs but remain in a bullish chart formation.
- The Bull Bear Power Indicator of the NASDAQ 100 turned bearish.
Market Sentiment Analysis
Equity markets could start the first week of August trading higher after a two-day sell-off. Friday’s NFP report remains in focus, suggesting a much worse-than-expected labor market. While markets bet on a September interest rate cut, tariffs are putting upside pressure on inflation, as baseline tariff rates have increased. It raises the spectre of stagflation, but today’s mood remains bullish. The second quarter earnings season continues and should provide short-term directional guidance.
Cisco Systems Fundamental Analysis
Cisco Systems is a technology company known for its networking, security, software, and cloud computing solutions. It has also faced allegations of collaboration with the Tailored Access Operations (TAO) unit of the NSA to intercept servers, routers, and other network gear.
So, why am I bearish on CSCO after its breakdown?
Cisco Systems ranks among the leading income stocks among hedge funds, but I cannot ignore its balance sheet red flags. The trust issues surrounding CSCO equipment appear minor, as its US business is healthy, but its innovation is stagnant compared to competitors. It continues to improve its fundamentals, but I believe an extension of the breakdown will bring it closer to a long-term buying opportunity.

The price-to-earning (P/E) ratio of 27.39 makes CSCO an inexpensive stock. By comparison, the P/E ratio for the NASDAQ 100 is 40.51.
The average analyst price target for CSCO is 72.11. It suggests moderate upside potential, but short-term risks have accelerated.
Cisco Systems Technical Analysis
Today’s CSCO Signal

- The CSCO D1 chart shows a breakdown below its horizontal resistance zone.
- It also shows price action completing a breakdown below its ascending 38.2% Fibonacci Retracement Fan level.
- The Bull Bear Power Indicator is bearish with a descending trendline.
- Trading volumes have increased during selloffs.
- CSCO trended sideways as the NASDAQ 100 Index reached all-time highs, a significant bearish development.
My Call
Top Regulated Brokers
I am taking a short position in CSCO between 66.52 and 67.49. I believe the current breakdown is the start of a correction. The lack of innovation and sideways trend as the NASDAQ 100 pushed higher are two significant red flags.
- CSCO Entry Level: Between 66.52 and 67.49
- CSCO Take Profit: Between 52.11 and 56.12
- CSCO Stop Loss: Between 71.17 and 73.31
- Risk/Reward Ratio: 3.10
Ready to trade our free daily signals? Here is our list of the best brokers for trading worth checking out.
