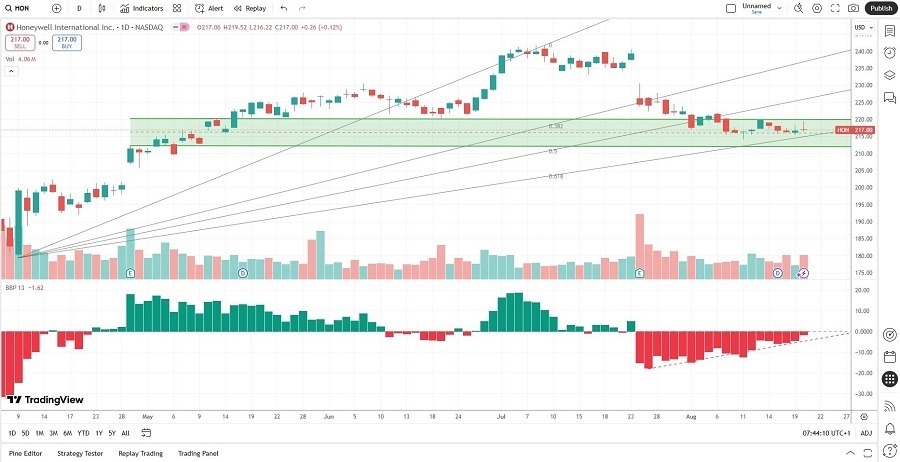
Long Trade Idea
Enter your long position between 212.43 (the lower band of its horizontal resistance zone) and 220.37 (the upper band of its horizontal resistance zone).
Market Index Analysis
- Honeywell International (HON) is a member of the Dow Jones Industrial Average, NASDAQ 100, the S&P 100, and the S&P 500
- All four indices sustain record highs, but volatility and AI bubble concerns are rising
- The Bull Bear Power Indicator of the S&P 500 turned bearish, and the negative divergence remains intact
Market Sentiment Analysis
Concerns over AI spending, fatigue over Big Tech amid excessive valuations, and comparisons to the Dot-Com bubble have spiked worries that the current market environment resembles an AI bubble. The release of minutes from the latest FOMC meeting showed inflation as the primary focus amid the ongoing tariff uncertainty. All eyes are now on earnings from Walmart and the Jackson Hole Economic Symposium. Equity futures indicate an ongoing sell-off, and tech stocks may face further pressure.
Honeywell International Fundamental Analysis
Honeywell International is a conglomerate with aerospace, building automation, industrial automation, and energy and sustainability solutions (ESS) at its core. Additionally, it operates Sandia National Laboratories and has a global workforce of over 100,000 employees.
So, why am I bullish on HON after its post-earnings sell-off?
HON plans to split into three publicly traded companies and continues to sell non-core, multi-billion-dollar revenue companies. It will reap the benefits from the increase in global defense spending and domestic manufacturing, especially in data centers. Hedge funds consider Honeywell International the best manufacturing stock, and I see a price-action recovery ahead.
Honeywell International Fundamental Analysis Snapshot

The price-to-earnings (P/E) ratio of 24.61 makes HON an inexpensive stock. By comparison, the P/E ratio for the S&P 500 is 29.59
The average analyst price target for HON is 251.60. It suggests excellent upside potential with decreasing downside risks.
Honeywell International Technical Analysis
Today’s HON Signal

- The HON D1 chart shows price action inside its horizontal support zone
- It also indicates price action between its ascending 50.0% and 61.8% Fibonacci Retracement Fan levels
- The Bull Bear Power Indicator is bearish with an ascending trendline and approaching a bullish crossover
- The average bearish trading volumes are higher than the average bullish trading volumes, suggesting more volatility ahead
- HON flatlined with the S&P 500 moving lower, a bullish trading signal
My Call
I am taking a long position in HON between 212.43 and 220.37. The recent sell-off created an excellent entry opportunity, as HON has the fundamentals and business model for a massive price action recovery in H2.
- HON Entry Level: Between 212.43 and 220.37
- HON Take Profit: Between 241.64 and 251.60
- HON Stop Loss: Between 201.72 and 205.79
- Risk/Reward Ratio: 2.73
Ready to trade our free daily signals? Here is our list of the best brokers for trading worth checking out.
