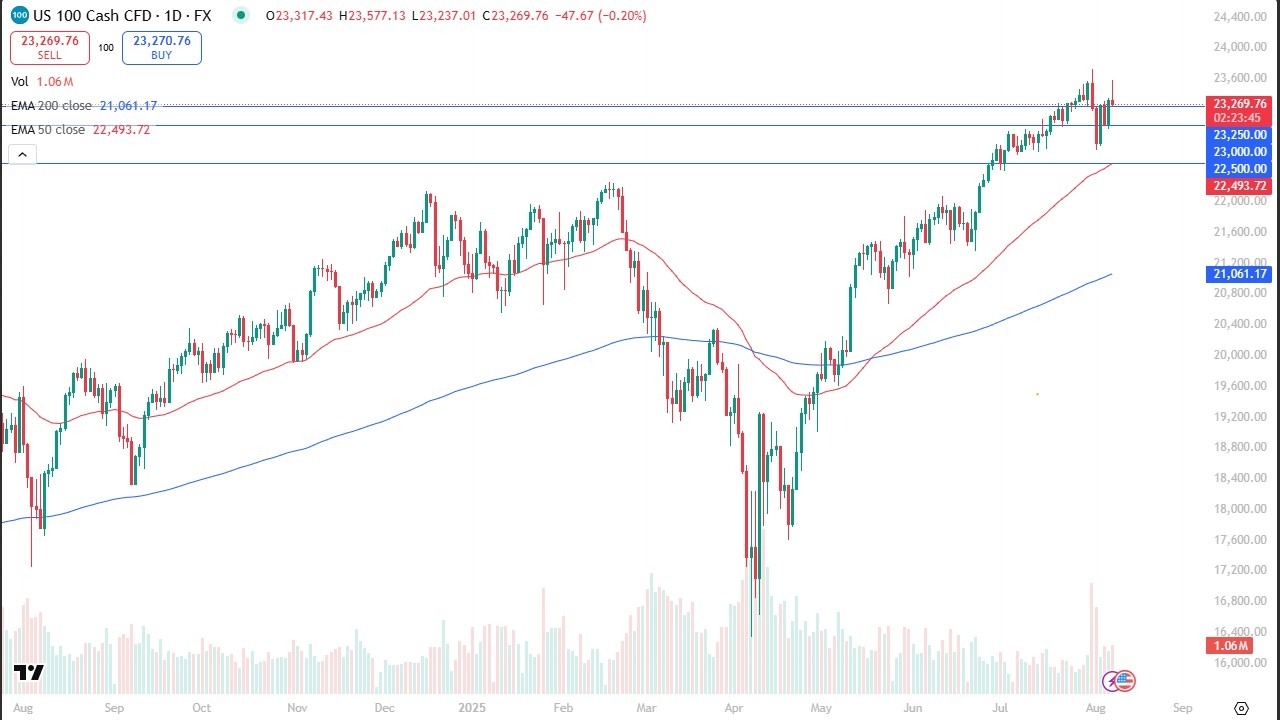
- The NASDAQ 100 initially shot higher during the trading session on Thursday but has since turned around in a very epic meltdown fashion.
- That being said, when you look at the longer-term chart, it’s easy to see that there is a lot of noise just below, and it would not surprise me at all to see this market bounce again.
- A longer-term chart simply looks like a very bullish market that is trying to work off some of the excess froth.

Technical Analysis
Top Regulated Brokers
The technical analysis for this market is obviously very bullish from a longer-term standpoint, but I’ll be the first to admit that the Thursday candlestick was horrible. This is a market that has seen a lot of erratic selling and dumping stocks, in a seemingly random pattern. This was a very bad trading session, and I think a lot of people probably lost a lot of money. There were moments where it looked like the market will bounce, only to have those bounces evaporate almost immediately. That being said, I think the downside is somewhat limited, with the 23,250 level being support, followed by the 23,000 level.
Ultimately, the market were to break above the top of the candlestick for the trading session for Thursday, that would be an extraordinarily bullish turn of events, and we could see this market really take off to the upside. However, it’s obvious that there is a lot of strange panic out there and it also seems as if there is somebody out there spoofing the latter in the DOM, so somebody out there is manipulating the market back and forth. In other words, somebody with size is going to cause problems and you need to be very cautious trading in this market. Longer-term, this still remains bullish market, and I have no interest whatsoever in trying to fight the overall momentum
Ready to trade our stock market forecast and analysis? Here are the best CFD stocks brokers to choose from.
