Fundamental Analysis & Market Sentiment
I wrote on 3rd August that the best trades for the week would be:
- Long of Bitcoin following a daily close above $120,055. This did not set up.
- Long of Gold following a daily close above $3,433 or $3,500 for more cautious traders. This did not set up.
The news last week was dominated by Fed Chair Jerome Powell’s Jackson Hole speech, which was widely expected to take a hawkish tilt by pushing back against expectations of a September rate cut. In fact, the speech went the other way, giving a dovish surprise, which sent US stock markets soaring and the US Dollar tumbling. The benchmark S&P 500 Index ended the week close to its recently made record all-time high price.
A summary of last week’s other important data:
- Canadian CPI (inflation) – as expected.
- US FOMC Meeting Minutes – no surprises.
- Reserve Bank of New Zealand Policy Meeting – rate cut as expected from 3.25% to 3.00%.
- UK CPI (inflation) was a fraction hotter than expected, showing an annualized rate of 3.8%.
- US, German, British Flash Services & Manufacturing mostly eceeded expectations slightly.
- US Unemployment Claims – slightly worse than expected.
There was less directional volatility than has been usual over recent weeks.
Monday’s US stock market will be key to whether the enthusiasm generated by Powell’ Jackson Hole speech continues or not. A new record high close in the S&P 500 Index on Monday could be bullishly very significant.
The Week Ahead: 25th – 29th August
The coming week has a very light program of high impact data releases, although the schedule does inclide a couple of important US points.
This week’s important data points, in order of likely importance, are:
- US Preliminary GDP – this will be closely watched to see if Trump’s new tariffs are starting to have any negative impact
- US Core PCE Price Index
- Canadian GDP
- Australian CPI (inflation)
Monthly Forecast August 2025

Currency Price Changes and Interest Rates
For the month of August 2025, I forecasted that the EUR/USD currency pair would rise in value.
I abandoned my forecast at a profit earlier in the month.

August 2025 Monthly Forecast Final Performance
Weekly Forecast 25th August 2025
I made no weekly forecast last week.
There were no unusually large price movements in currency crosses last week, so I again make no weekly forecast this week.
The Euro was the strongest major currency last week, while the US Dollar was the weakest, although the overall directional movement was quite small. Volatility was low last week, with only 15% of the most important Forex currency pairs and crosses changing in value by more than 1%. Next week’s volatility is likely to decrease even futher.
Monday is a public holiday in the UK.
You can trade these forecasts in a real or demo Forex brokerage account.
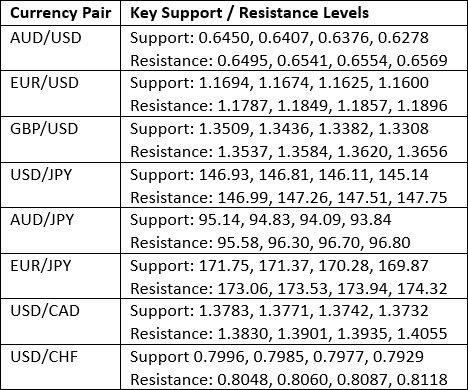
Key Support/Resistance Levels for Popular Pairs

Key Support and Resistance Levels
Technical Analysis
US Dollar Index
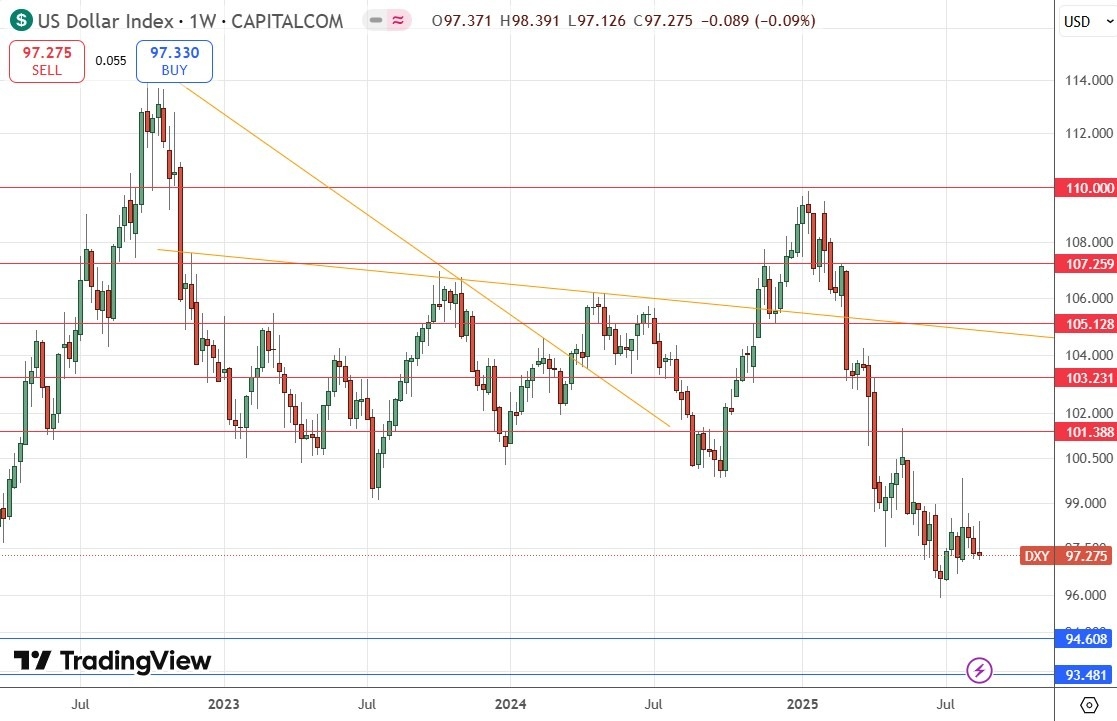
Last week, the US Dollar Index printed a bearish engufling candlestick which was also a bearish pin bar, so this bearish price action is in line with the long-term bearish trend. Lower prices in the US Dollar look likely, especially after Fed Chair Jerome Powell poured cold water on the Fed again holding off on a rate hike at its next meeting in September.
I think it is wise to trade with the long-term trend and short term price action right now, so trades short of the US Dollar will probably be wise over the coming week.US Dollar Index Weekly Price Chart
S&P 500 Index
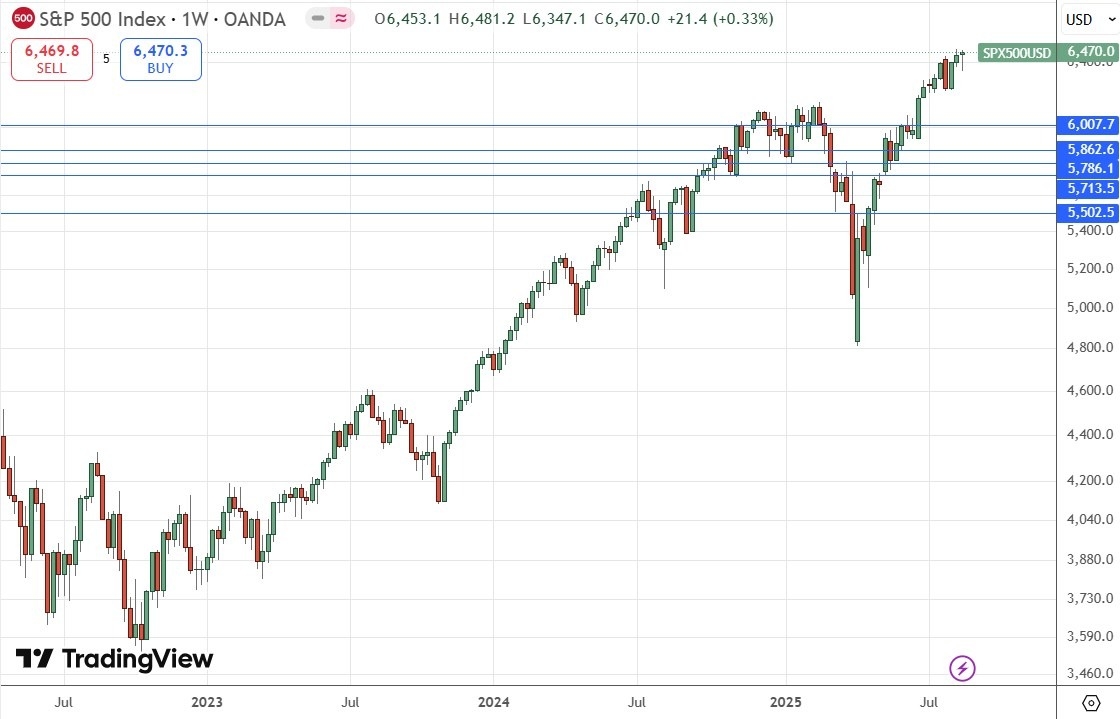
The S&P 500 Index made a a strong gain on Friday after Jerome Powell’s speech at Joackdon Hole, which rekindled faith that the Fed is finally about to get going on rate cuts. During the earlier part of last week, the Index was threatening to make a deeper retracement as it declined, but it closed the week very near its high (a bullish sign) and is again within sight of its all-time high not far from the big round number at 6,500.
It is also significant that the weekly candestick is a bullish pin bar.
Record highs on Monday are more significant than record highs on Friday, so if we get a daily (New York) close above 6,471 next week, that ould be a great signal to enter a new long trade, especially if it sets up on Monday.

S&P 500 Index Weekly Price Chart
XAU/USD
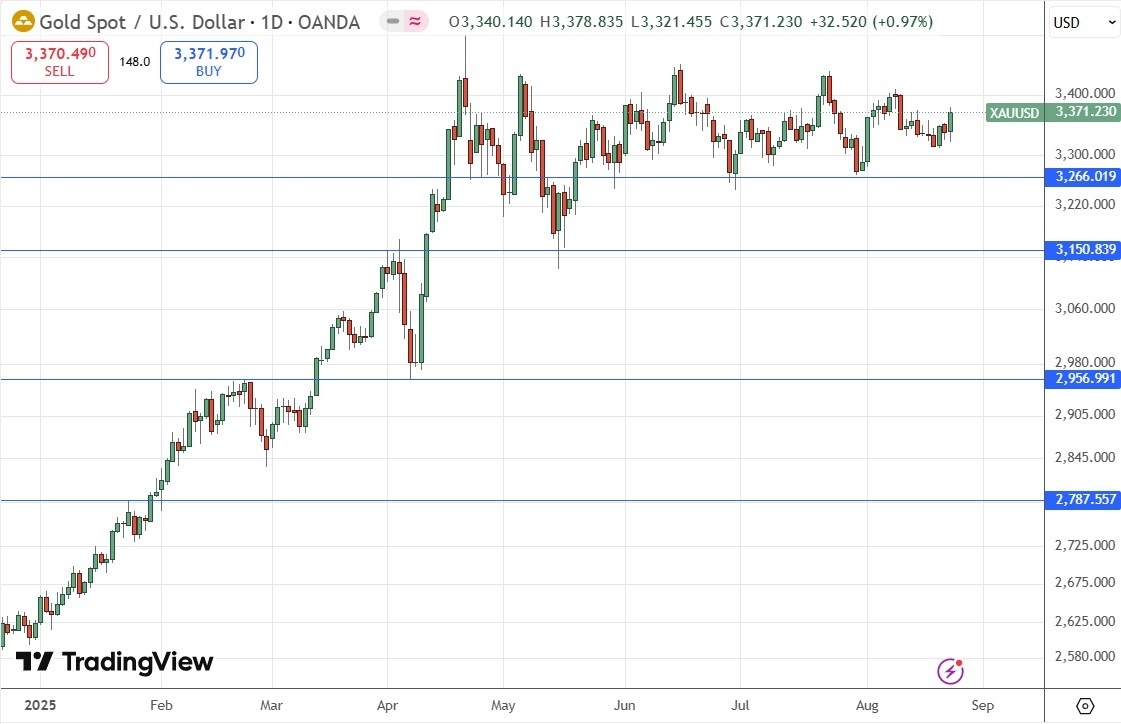
Many precious metals including Gold were making new highs in recent weeks, but we then saw a major selloff. However, with Friday’s renewed risk appetite, Gold has risen firmly to approach the $3,400 area again, within sight of its record high at about $3,500.
Gold is in a very long-term bullish trend, so I think it is worth a long trade entry if we get a New York daily close above $3,433. However, it is worth noting the price has flopped three times from this level in succession, so it may be wiser for more cautious traders to wait for a breakout above the major round number at $3,500. Note the multi-week consolidation pattern between $3,500 and $3,266 shown in the price chart below.
Gold can also sometimes hold up its value even when risk appetite is not strong.

XAU/USD Daily Price Chart
XAG/USD
Much of what I wrote about Gold above can also be applied to Silver, which is also technically a precious metal, although it has major industrial use.
Silver is in a very long-term bullish trend, so I think it is worth a long trade entry if we get a New York daily close above $39.29. However, it is worth noting that a major round number at $40 is within sight of this area, so more cautious traders might want to wait until the price makes a daily close above $40 before entering a new long trade here.
Bottom Line
I see the best trades this week as:
- Long of the S&P 500 Index if we see a daily (New York) close above 6,471.
- Long of Gold following a daily (New York) above $3,433 or $3,500 for more cautious traders.
- Long of Silver following a daily (New York) above $39.29 or $40 for more cautious traders.
Ready to trade our Forex weekly forecast? Check out our list of the top 10 best Forex brokers in the world.
