Bitcoin
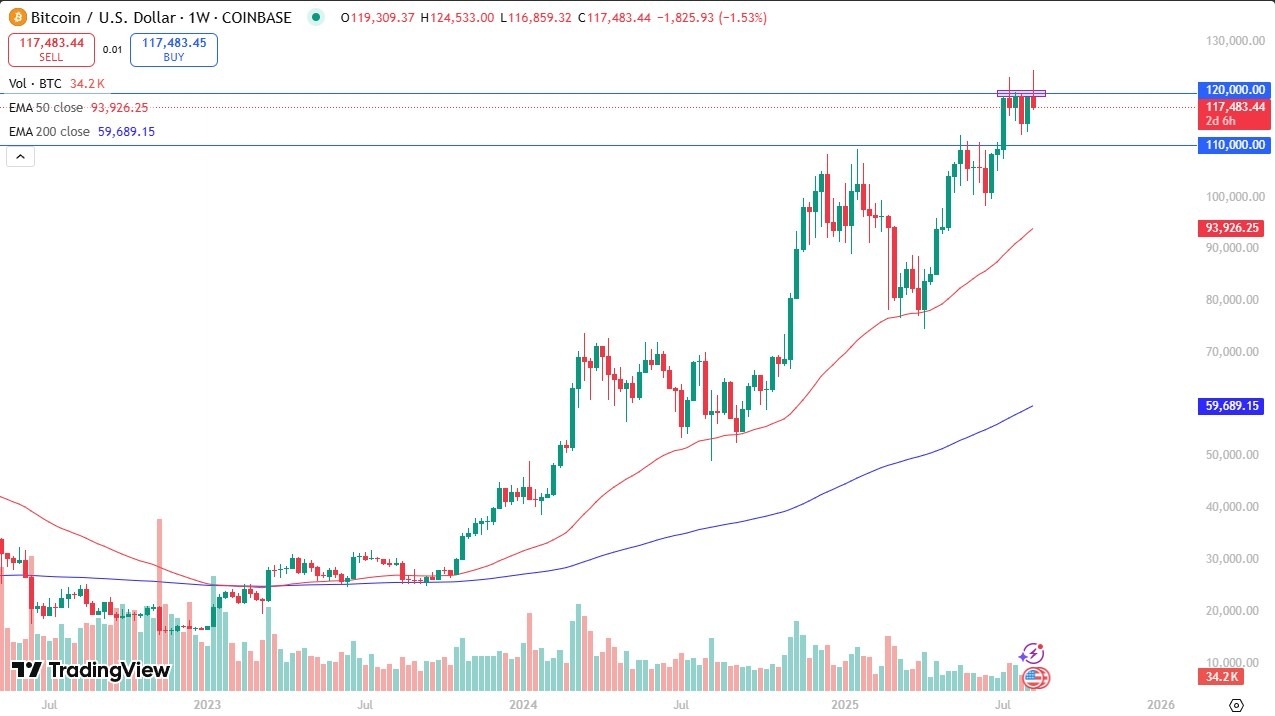 Bitcoin rallied significantly during the early part of the week to break above the $120,000 level but has turned around to show signs of exhaustion. The candlestick form for the week of course is a shooting star, so this tells me that perhaps Bitcoin is not ready to break out to the upside. We might get a little bit of a pullback, and I think that might be a situation that makes a lot of sense considering that we are in the dead of summer. I still see a significant amount of support near the $110,000 level, as it is the “floor in the market.”
NASDAQ 100
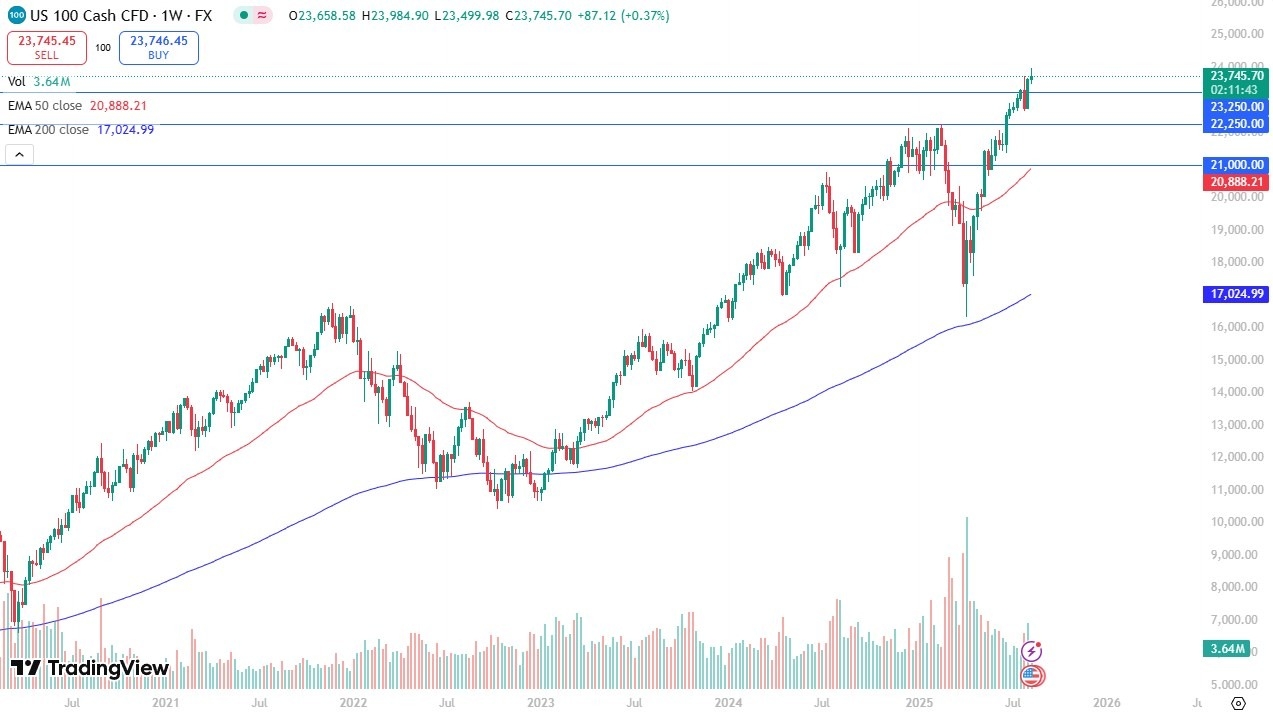 The NASDAQ 100 tried to rally for the week but has also turned around to show signs of exhaustion. The candlestick looks a lot like a shooting star, and it tells me that this is a market that may need to pull back a bit in order to find buyers. If we can find some type of value underneath, then it makes a lot of sense that we would see buyers willing to step in and take advantage of this market, with the bottom of the weekly candlestick from the previous week being a potential support level as well, near the 22,800 level. The “Artificial Intelligence trade” continues to be one of the main drivers of positives sentiment.
Silver
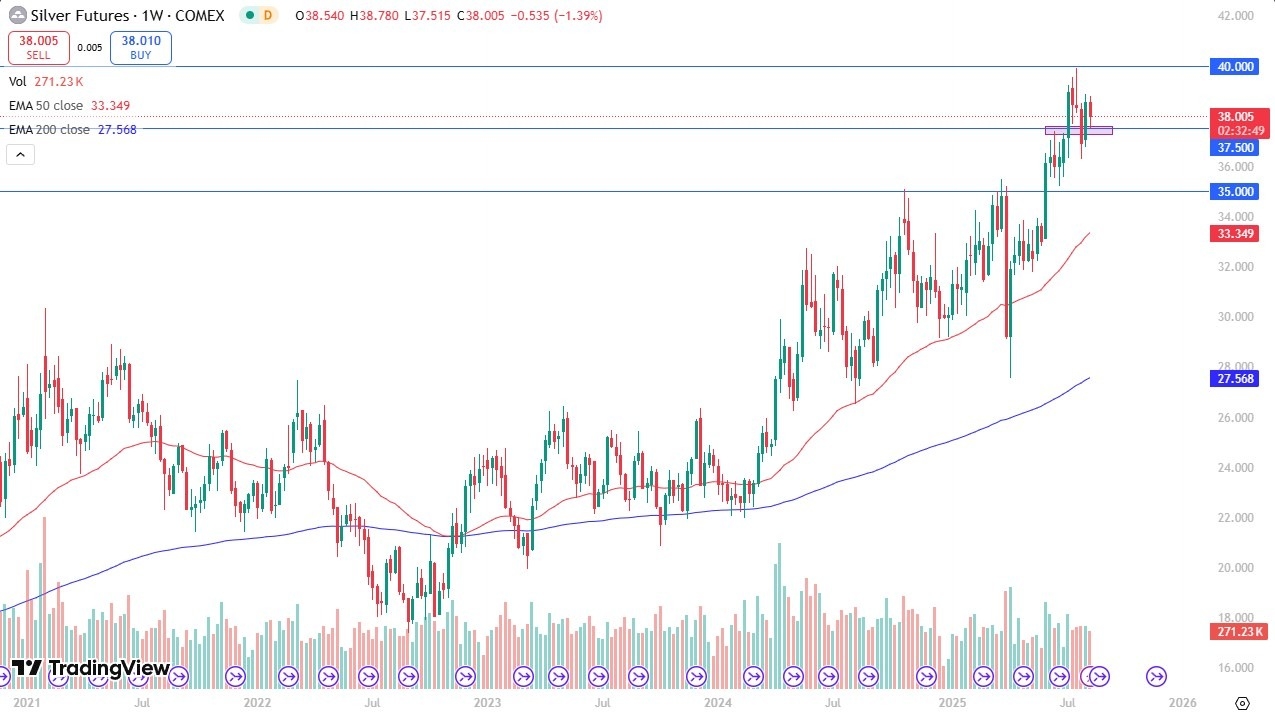
Silver fell significantly this week but continues to hang on to the $37.50 level as a potential support level. This of course is an area that has been important a couple of times in the past, and therefore it’s likely that we will continue to see more of a “buy on the dip” attitude in this market. I recognize that we might be a little bit exhausted, and I also recognize that we may be more sideways than anything else, but at this point in time, I’d be a bit surprised that the market could break down below the $36 level. I think we are just simply killing time between now and the beginning of September, when liquidity increases again.
Top Regulated Brokers
Gold
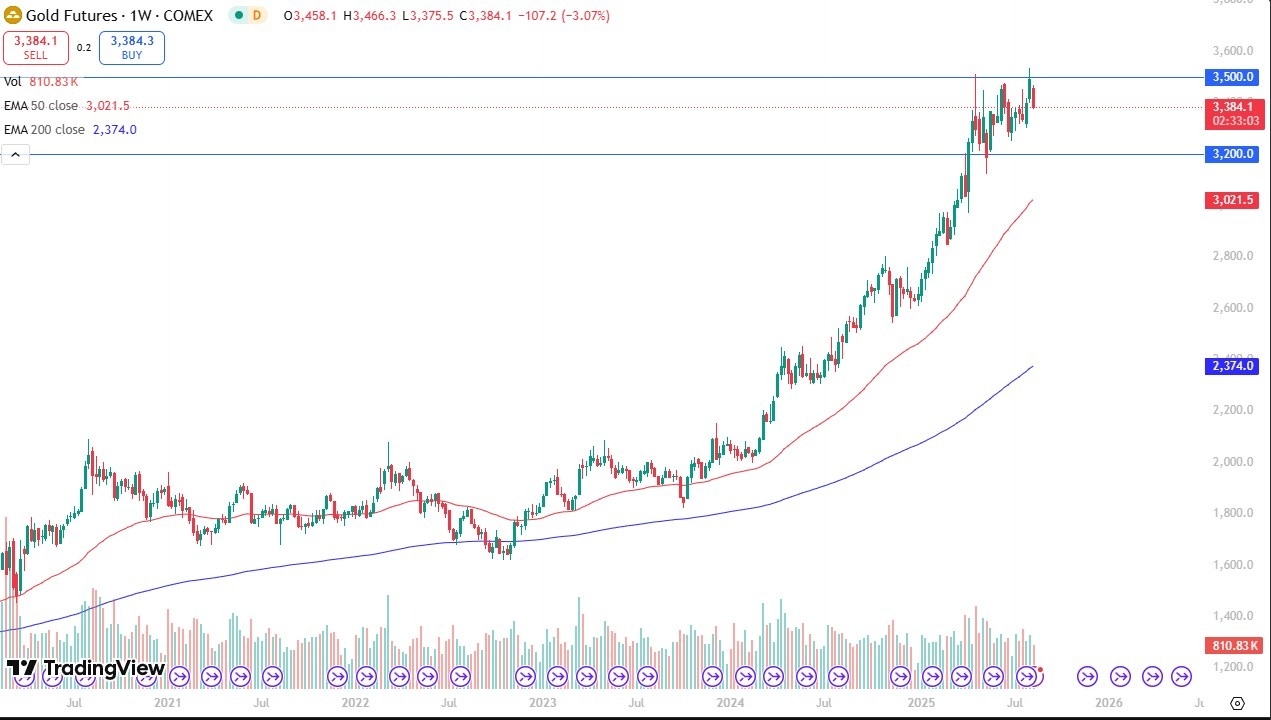
Gold has dropped pretty significantly during the trading week to break below the $3400 level, but it’s probably worth noting that on the daily charts it’s more or less a sideways market over the past 3 sessions. All things being equal, we are still very much in an uptrend, and I think short-term pullbacks will continue to be attractive. In fact, if you squint, you can look at this and see a bit of an ascending triangle. I think the next couple of weeks probably will just continue to see a lot of consolidation and back and forth trading.
GBP/USD
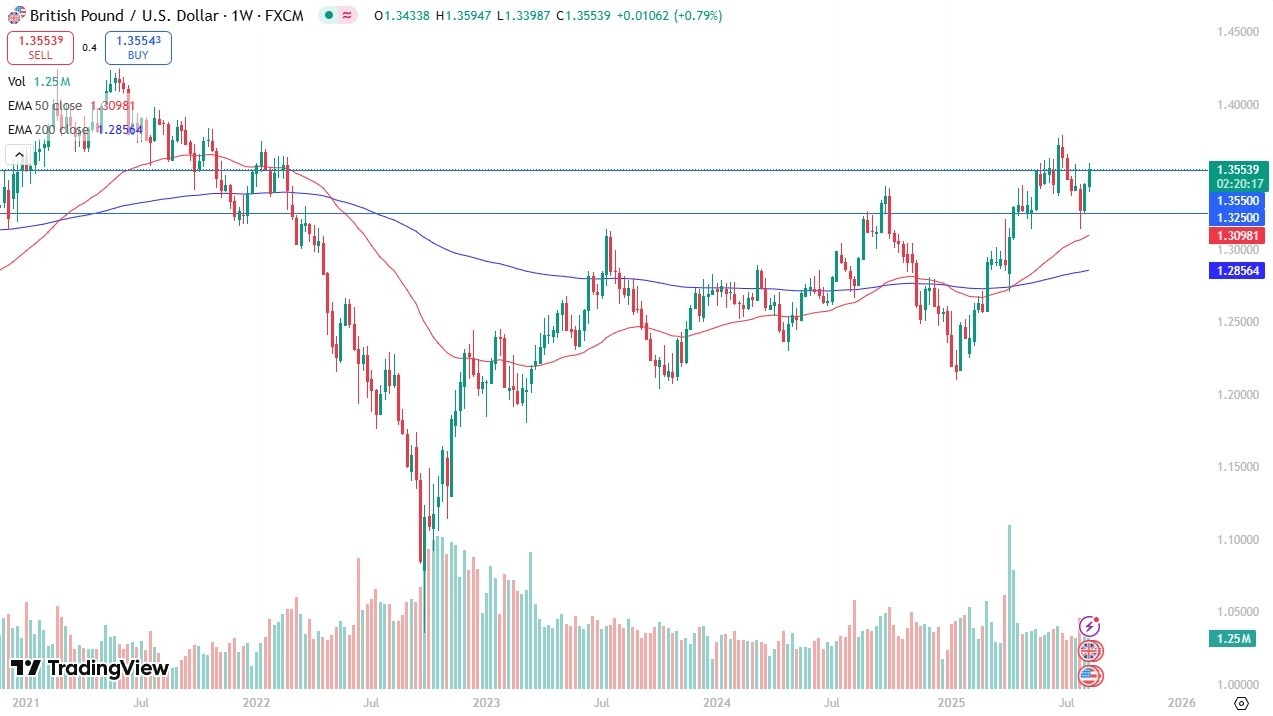
The British pound rallied significantly during the trading week but continues to see a lot of resistance near the 1.3550 level, and therefore although it looks fairly bullish for the last 2 weeks, the reality is that we are still finding resistance at the same level, and therefore I think we have to wait and see how this plays out. Traders are betting on the Federal Reserve cutting interest rates, so in theory the US dollar should weaken, but if we have concerns around the world about global growth, that could cause a few headaches.
EUR/USD
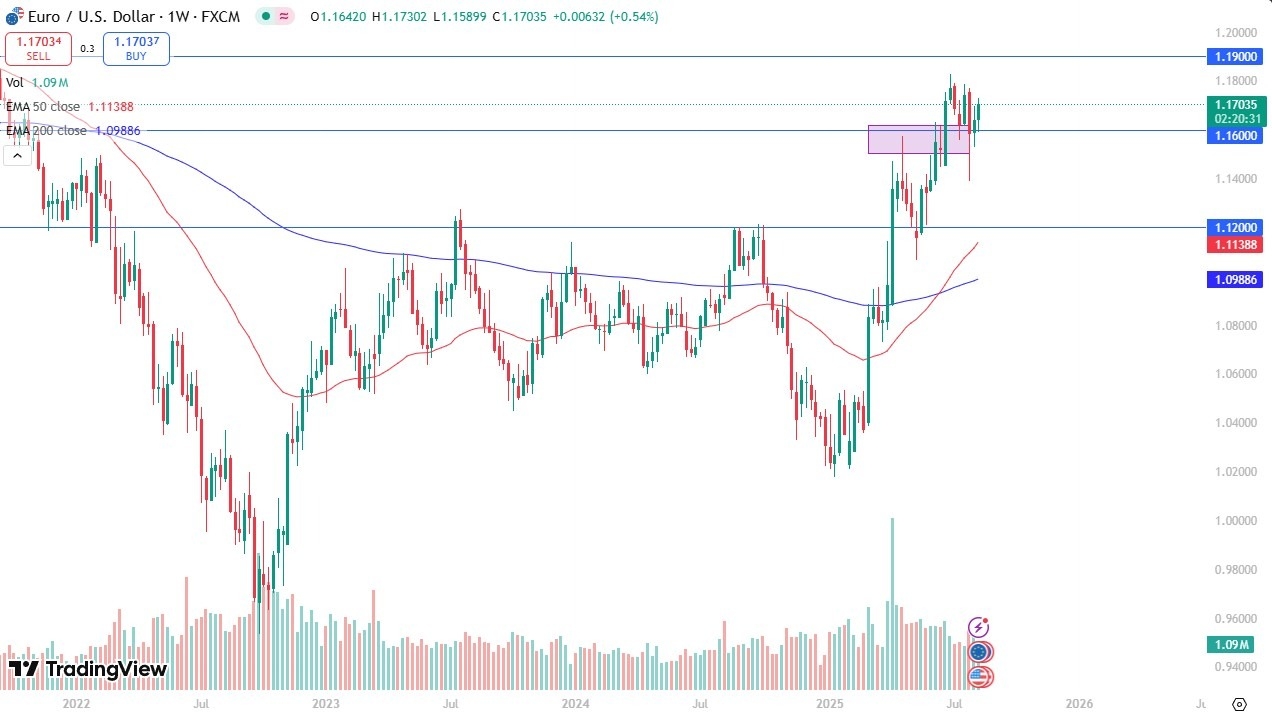
The euro initially fell during trading this week but has found support near the 1.16 level to turn things around and rally. We are closing the week near the 1.17 level, which is an area that has been a significant barrier, but even if we were to break above here, we need to pay close attention to the 1.18 level, an area that’s been a bit like a brick wall ultimately, I believe this is a market that will remain somewhat sideways in the short term.
USD/JPY
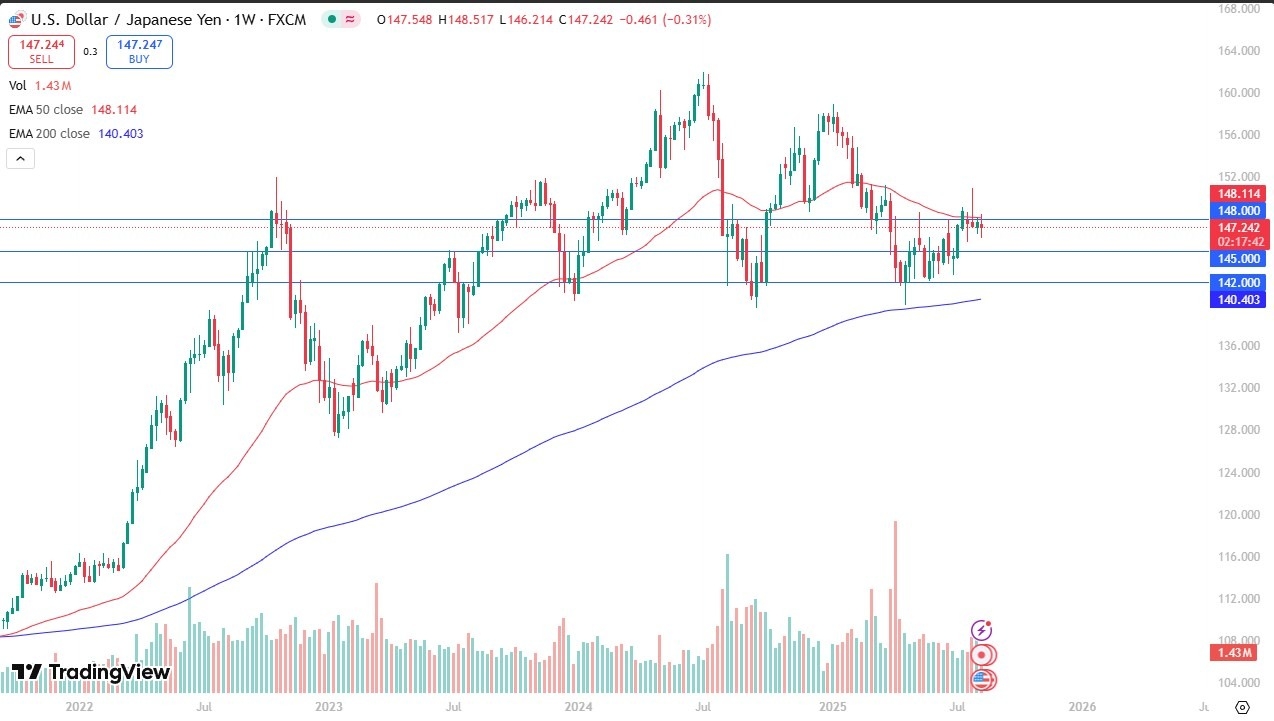
The US dollar has been all over the place against the Japanese yen during the trading week, as the ¥148 level continues to cause quite a few headaches for bulls. The 50 Week EMA is sitting right around there as well, so if we can break above there then it opens up the possibility of challenging that nasty shooting star from a couple of weeks ago, sending the US dollar toward the ¥151.50 level. If we break down from here, I think there is plenty of support near the ¥145 level, keeping the downside somewhat limited at the moment.
USD/MXN
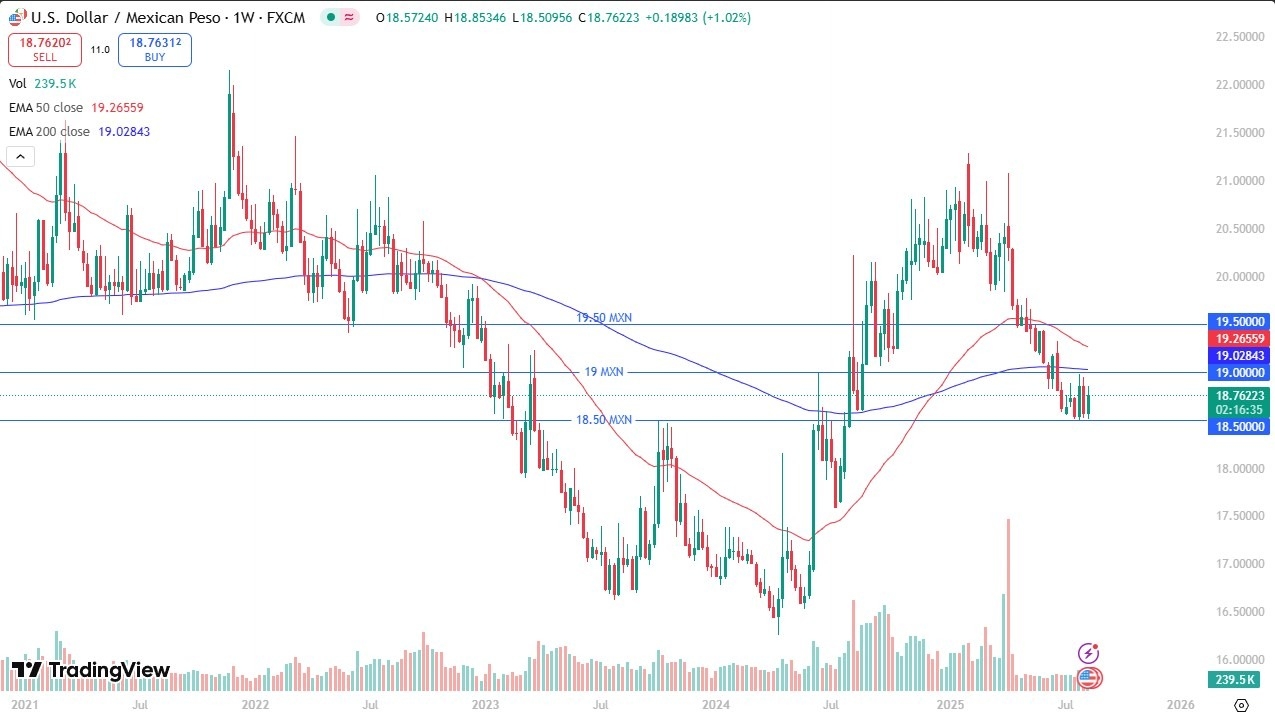
The US dollar rallied against the Mexican peso during the trading week, but we are still very much in a trading range between the 18.50 MXN level, and the 19 MXN level. The 200 Week EMA’s is just above the crucial 19 MXN level, so I think that is your ceiling in the market at the moment. Ultimately, I think we are just spinning our wheels at the moment, waiting for more liquidity to come into the markets in the month of September. Range bound trading will more likely than not continue to be the way forward.
Ready to trade our Forex weekly forecast? We’ve made a list of some of the best regulated forex brokers to choose from.
