Long Trade Idea
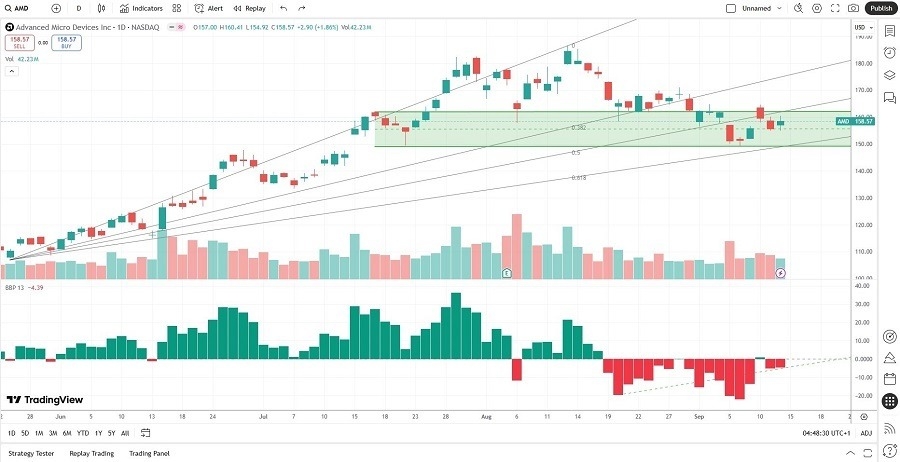
Enter your long position between $154.92 (Friday’s intra-day low) and $161.96 (the upper band of its horizontal resistance zone).
Market Index Analysis
- Advanced Micro Devices (AMD) is a member of the NASDAQ 100, the S&P 100, and the S&P 500.
- All three indices push higher, but downside risks are rising.
- The Bull Bear Power Indicator for the NASDAQ 100 shows a negative divergence and does not confirm the uptrend.
Market Sentiment Analysis
The NASDAQ closed at a fresh record, and major indices had a powerful run last week amid hopes for a 25 to 50-basis-point interest rate cut this week, with expectations for further reduction at each FOMC meeting for the rest of 2025. Investors chose to ignore sticky inflation and bet that weak labor market data would prompt interest rate cuts. The second-quarter earnings season is winding down, but FedEx is poised to grab investors’ attention. It serves as a global barometer for trade, especially after weak Chinese data.
Advanced Micro Devices Fundamental Analysis
Advanced Micro Devices is an industry-leading chip manufacturer at the forefront of the global AI race. It is also a core player in the gaming sector, where its hardware is among the best for high-end users, and a significant provider of server hardware to data centers.
So, why am I bullish on AMD after its sell-off?
Investors overreacted to the price reduction of the M1355 chip, creating an excellent long-term buying opportunity. Oracle’s blockbuster forecast for revenues will boost AMD, especially as companies test the M1400 rack. Valuations are high, but the PEG ratio confirms an undervalued share over a five-year outlook. The AI implementation and its gaming division should continue to deliver excellent results, and AMD has a healthy balance sheet.
The price-to-earning (P/E) ratio of 95.52 makes AMD an expensive stock. By comparison, the P/E ratio for the NASDAQ 100 is 35.72.
The average analyst price target for AMD is $185.77. It suggests good upside potential with reasonable downside risks.
Advanced Micro Devices Technical Analysis
Today’s AMD Signal
AMD Price Chart
- The AMD D1 chart shows price action inside its horizontal support zone.
- It also shows price action finding support between its ascending 50.0% and 61.8% Fibonacci Retracement Fan levels.
- The Bull Bear Power Indicator is bearish with an ascending trendline, approaching a bullish crossover.
- The average bearish trading volumes are higher than the average bullish trading volumes, but a slow shift began last week.
- AMD corrected as the NASDAQ 100 pushed higher, a bearish trading signal, but bullish catalysts have accumulated.
My Call on AMD
Top Regulated Brokers
I am taking a long position in AMD between $154.92 and $161.96. The PEG ratio indicates undervalued shares, suggesting that investors have overreacted to the price cut for the M1355 chip. AMD remains well-positioned to ride the AI and gaming wave higher, and I will buy the dip.
- AMD Entry Level: Between $154.92 and $161.96
- AMD Take Profit: Between $186.65 and $190.38
- AMD Stop Loss: Between $141.01 and $143.81
- Risk/Reward Ratio: 2.28
Ready to trade our free daily signals? Here is our list of the best brokers for trading worth checking out.


