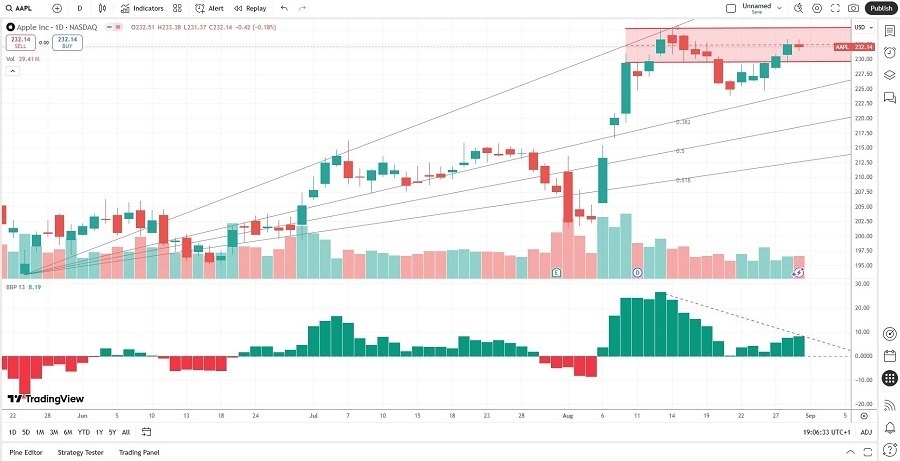
Short Trade Idea
Enter your short position between 229.35 (the lower band of its horizontal resistance zone) and 233.38 (Friday’s intra-day high).
Market Index Analysis
- Apple (AAPL) is a member of the NASDAQ 100, the Dow Jones Industrial Average, the S&P 100, and the S&P 500.
- All four indices trade near records, but technical breakdown signals are rising.
- The Bull Bear Power Indicator of the NASDAQ 100 is bearish with a descending trendline.
Market Sentiment Analysis
This week’s focus remains on the US August NFP report following a dismal July report. Uncertainty about the composition of the Federal Reserve’s Board of Governors and the risk of the Fed’s independence will equally weigh on sentiment. Manufacturing data and other employment data could inject volatility. Retailers have warned that the worst of the tariff impact is still ahead, and earnings calls have noted tariff impacts ahead from seven of the eleven sectors in the S&P 500.
Apple Fundamental Analysis
Apple is the largest tech company by revenue and the third-largest company by market capitalization. It is at the core of the US tech industry, but it is missing out on several disruptive trends. Still, it has high brand loyalty and a massive following.
So, why am I bearish on AAPL after its recent rally?
Apple continues to face medium-term issues, including the lack of an AI strategy and its wait-and-see approach to other disruptive industry and consumer trends. It is losing market share to its competition outside the US. Its current ratio is also a sign of moderate concern, adding to the mounting bearish pressures on AAPL.

Apple Fundamental Analysis Snapshot
The price-to-earnings (P/E) ratio of 35.23 makes AAPL an expensive stock. By comparison, the P/E ratio for the NASDAQ 100 is 33.88.
The average analyst price target for AAPL is 235.00. It suggests no upside potential but rising downside risks.
Apple Technical Analysis
Today’s AAPL Signal

Apple Price Chart
- The AAPL D1 chart shows a price action inside its horizontal resistance zone.
- It also shows price action between its ascending 0.0% and 38.2% Fibonacci Retracement Fan levels.
- The Bull Bear Power Indicator is bullish with a descending trendline.
- The average bearish trading volumes are higher than the average bullish trading volumes.
- AAPL drifted higher as the NASDAQ 100 moved lower, a bullish trading signal, but bearish pressures are rising.
My Call on Apple
Top Regulated Brokers
I am taking a short position in AAPL between 229.35 and 233.38. The lack of an AI vision will further erode its market share outside the US. Price increases from tariffs, especially from its Indian-made factories, will either lower sales, profits, or both. I will sell the rally.
- AAPL Entry Level: Between 229.35 and 233.38
- AAPL Take Profit: Between 196.46 and 205.59
- AAPL Stop Loss: Between 244.91 and 250.00
- Risk/Reward Ratio: 2.11
Ready to trade our free daily signals? Here is our list of the best brokers for trading worth checking out.
