Equity markets continue to soar despite mild “stagflationary” pressures from a labor market that is much weaker than initially feared and inflation drifting in the wrong direction. Valuations for most stocks are excessive and do not reflect economic reality. Still, patient investors may find some interesting stocks among the best cheap stocks trading above $5 but below $10 per share. The bargain price carries heightened risk, and investors must understand what to look for before loading their portfolios with cheap stocks. Let’s take a look at the best cheap stocks to buy today!
Top Regulated Brokers
What are Cheap Stocks?
While there is no exact definition of “cheap stocks,” as it depends on individual preferences, they typically refer to listed companies that trade between $5 and $10 per share. Cheap stocks are available in every sector and offer numerous opportunities to diversify portfolios.
Why Should you Consider Investing in Cheap Stocks?
Cheap stocks an cprovide exciting growth opportunities for investors who are patient and know what to look for. They can also offer exposure to cutting-edge technology, medicine, AI, and other companies that have not yet achieved a breakthrough but are on the verge of disrupting their industries.
Here are a few things to consider when evaluating cheap stocks:
- Invest in cheap stocks with a proven management team that has a history of turning around companies.
- Research and understand the industry and how a cheap stock can make a notable impact with their product or service.
- Analyze the balance sheet carefully and dig through several quarters of financial reports to ensure the cheap stock is low on debt, has growing revenues, and plenty of cash reserves.
- Always keep a separate portfolio for cheap stocks.
What are the Downsides of Cheap Stocks?
Investors should understand that cheap stocks trade at bargain prices for a reason, and before they commit capital, they must know why the price is where it is. There could be financial issues, operational risks, going-concern warnings, legal troubles, and other problems that investors should be aware of. The risk is higher, and volatility remains elevated due to less liquidity.
Here is a shortlist of cheap stocks to consider:
- Mizuho Financial Group (MFG)
- Amprius Technologies (AMPX)
- Itaú Unibanco Holding (ITUB)
- Palladyne AI Corporation (PDYN)
- United Microelectronics Corporation (UMC)
- Turkcell Iletisim Hizmetleri (TKC)
- SNDL (SNDL)
- The Arena Group Holdings (AREN)
- CCC Intelligent Solutions Holdings (CCCS)
- Mercurity Fintech Holding (MFH)
Mizuho Financial Group Fundamental Analysis
Mizuho Financial Group (MFG) is a Japanese banking holding company and the parent company of Mizuho Bank, Mizuho Trust & Banking, Mizuho Securities, and Mizuho Capital. Upon its inception, it was the largest bank globally by assets, but today it is the third-largest Japanese mega bank. Mizuho Financial Group is also a component of the Nikkei 225 and the TOPIX Core 30.
So, why am I bullish on MFG despite its 25% rally this summer?
I appreciate the core business strength at Mizuho Financial Group. Its latest quarterly results showed a 30% growth in net interest income and 9% growth in fee income, which could spark buybacks and investments to continue outperforming peers. Valuations are low, and MFG continues to improve its profit margins. The healthy dividend is a bonus for holding its stock.
Metric | Value | Verdict |
P/E Ratio | 13.77 | Bullish |
P/B Ratio | 1.15 | Bullish |
PEG Ratio | 1.32 | Bullish |
Current Ratio | Unavailable | Bearish |
Return on Assets | 0.31% | Bearish |
Return on Equity | 8.48% | Bullish |
Profit Margin | 21.42% | Bullish |
ROIC-WACC Ratio | Unavailable | Bearish |
Dividend Yield | 3.02% | Bullish |
Mizuho Financial Group Fundamental Analysis Snapshot
The price-to-earnings (P/E) ratio of 13.77 makes MFG an inexpensive stock. By comparison, the P/E ratio for the S&P 500 is 29.45.
The average analyst price target for MFG is 6.75. It suggests limited upside potential, but fundamentals could catapult prices higher.
Mizuho Financial Group Technical Analysis
Mizuho Financial Group Price Chart
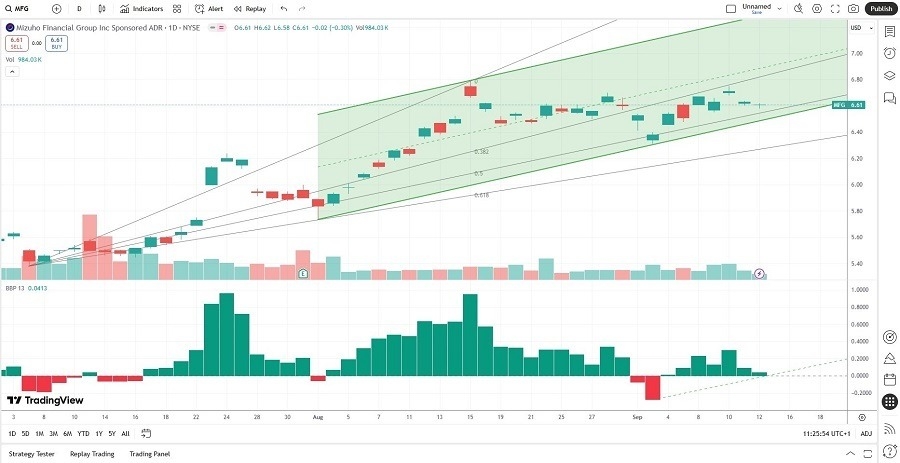
- The MFG D1 chart shows price action trading between its ascending 38.2% and 50.0% Fibonacci Retracement Fan levels.
- It also shows Mizuho Financial Group inside a bullish price channel with rising bullish trading volumes.
- The Bull Bear Power Indicator is bullish and has been so for almost two months.
My Call on Mizuho Financial Group
I am taking a long position in MFG between $6.48 and $6.75. I cannot rule out a short-term pullback, which I will take as an excellent buying opportunity. The price-to-book ratio limits downside potential, the PEG ratio suggests untapped potential, and the core business model is strong.
Turkcell Iletisim Hizmetleri Fundamental Analysis
Turkcell Iletisim Hizmetleri (TKC) is the leading mobile phone operator of Turkey, with the Turkey Wealth Fund as its largest shareholder (a 26.2% stake). TKS is one of the world’s largest companies and covers 100% of the population living in cities with over 3,000 residents across Turkey.
So, why am I bullish on Turkcell Iletisim Hizmetleri after its breakout?
Turkcell Iletisim Hizmetleri has low leverage and limited Forex exposure, shielding it against the negative impacts of the Turkish Lira. Pending price hikes for mobile and fiber optics could boost its excellent profit margins and return on assets. The dividend makes it an excellent long-term buy, and TKC trades below its book value, presenting a unique buying opportunity. TKS was also named among the best companies to work for by TIME.
Metric | Value | Verdict |
P/E Ratio | 15.94 | Bullish |
P/B Ratio | 0.91 | Bullish |
PEG Ratio | 0.15 | Bullish |
Current Ratio | 1.73 | Bearish |
Return on Assets | 6.36% | Bullish |
Return on Equity | 12.68% | Bullish |
Profit Margin | 12.40% | Bullish |
ROIC-WACC Ratio | Negative | Bearish |
Dividend Yield | 4.02% | Bullish |
Turkcell Iletisim Hizmetleri Fundamental Analysis Snapshot
The price-to-earnings (P/E) ratio of 15.94 makes TKC an inexpensive stock. By comparison, the P/E ratio for the S&P 500 is 29.45.
The average analyst price target for Turkcell Iletisim Hizmetleri is $7.87. It suggests excellent upside potential with limited downside risks.
Turkcell Iletisim Hizmetleri Technical Analysis
Turkcell Iletisim Hizmetleri Price Chart
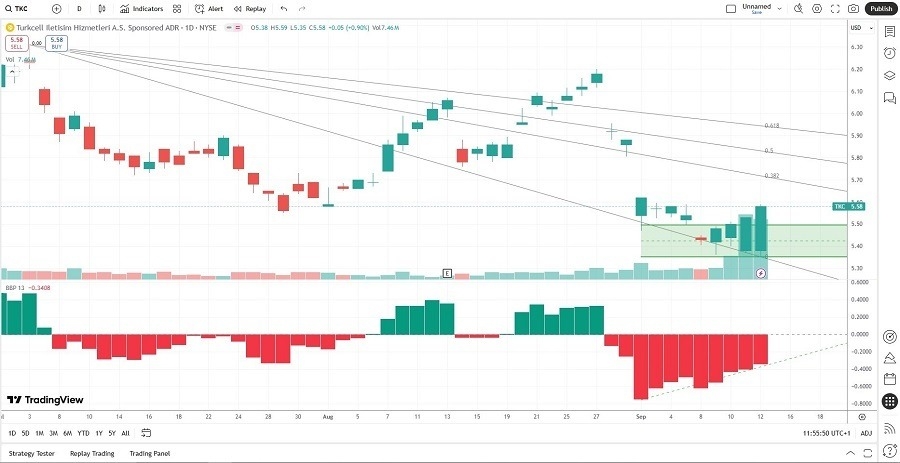
- The TKC D1 chart shows price action between its descending 0.0% and 38.2% Fibonacci Retracement Fan.
- It also shows Turkcell Iletisim Hizmetleri breaking out above its horizontal support zone with surging bullish trading volumes.
- The Bull Bear Power Indicator is bearish, with an ascending trendline since the start of September.
My Call on Turkcell Iletisim Hizmetleri
I am taking a long position in Turkcell Iletisim Hizmetleri between $5.35 and $5.62. The price-to-book ratio, low valuations, and superb dividend yield make TKC one of the most appealing buys I have researched this year.
Ready to trade the best cheap stocks? Take a look at our list of the best stock brokers.


