Bearish view
- Sell the BTC/USD pair and set a take-profit at 107,000.
- Add a stop-loss at 117,000.
- Timeline: 1-2 days.
Bullish view
- Buy the BTC/USD pair and set a take-profit at 117,000.
- Add a stop-loss at 107,000.
The BTC/USD pair rose to above 113,200 as investors embraced a risk-on sentiment after the relatively weak US wholesale inflation data. Bitcoin was trading at $113,200 on Thursday morning, higher than this month's low of $107,365.
Risk-On Sentiment Prevails
The BTC/USD pair rose as market participants embraced a risk-on outlook after the US released lower-than-expected inflation data, raising the possibility that the Fed will deliver a 0.50% rate cut in next week's meeting.
This report showed that the headline and core Producer Price Index dropped sharply in August, even as Donald Trump's tariffs remained.
In a statement after the report, Trump pressed the Fed to deliver a big cut. In the past, he floated a mega 300 basis point cut that would take the benchmark rate to 1%.
Top Regulated Brokers
Most analysts see the bank cutting rates by 0.25%, which will bring the benchmark from the current 4.50% to 4.25%. Others expect the bank to cut by 50 basis points now that the labor market is largely in a recession.
Bitcoin and other risky assets thrive in a period of easy money policies because investors tend to rotate from the low-yielding government bonds. This also explains why Amerian stocks have also jumped.
The BTC/USD pair has held steady as the US dollar index continued falling. It moved to $97 from the year-to-date high of $110 as investors embraced other currencies because of Donald Trump's policies.
Meanwhile, there are signs that demand remains significant. Data shows that spot Bitcoin ETFs have had inflows worth over $54.8 billion since January last year. They have already added over $637 million in inflows this month so far, a trend that will continue in the coming weeks.
BTC/USD Technical Analysis
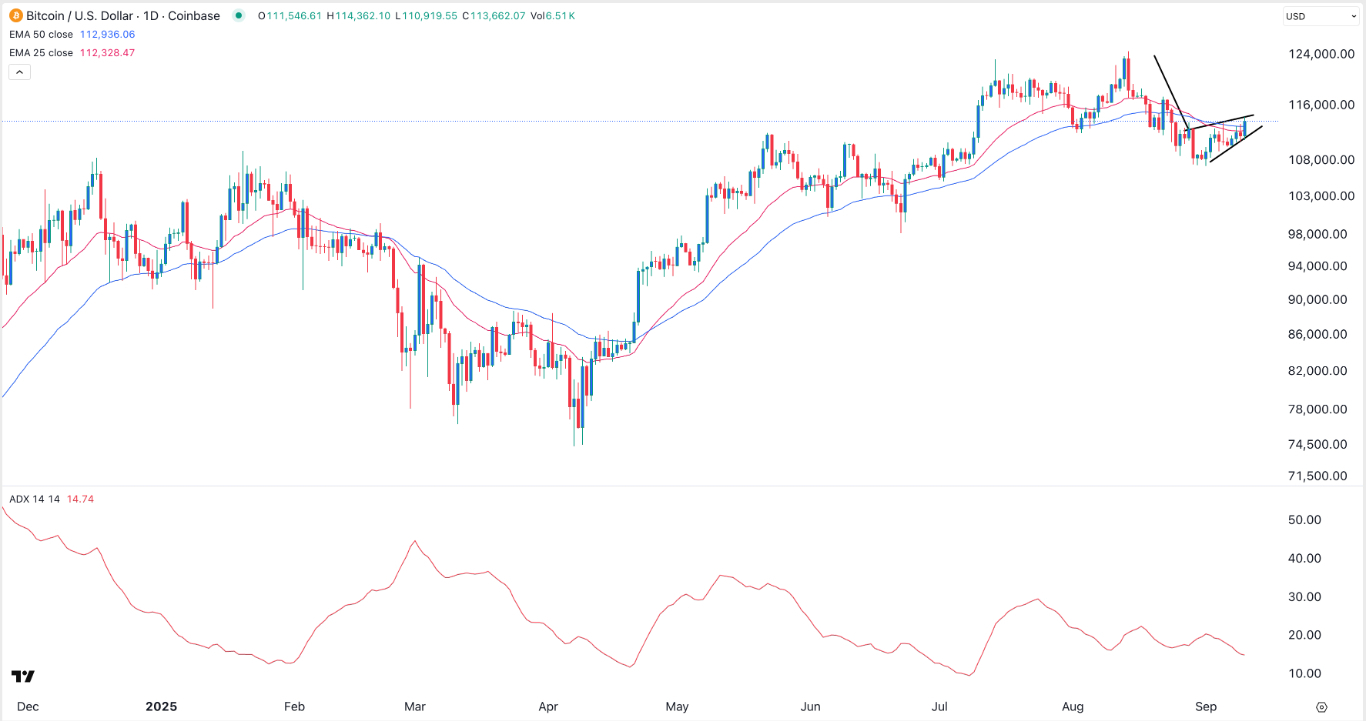
The daily timeframe chart shows that the BTC/USD pair has crawled back in the past few days, moving from 107,289 earlier this month to over 114,200 today.
It has slowly formed the risky rising wedge pattern, which comprises two ascending and converging trendlines. The pair has also formed a bearish flag pattern and is now hovering at the 50-day moving average.
The Average Directional Index, which measures the strength of a trend, has tumbled to the lowest point since July. Therefore, the most likely scenario is where the pair resumes the downtrend and possibly moves to 100,000.
Ready to trade our free Forex signals? Here are the best MT4 crypto brokers to choose from.

