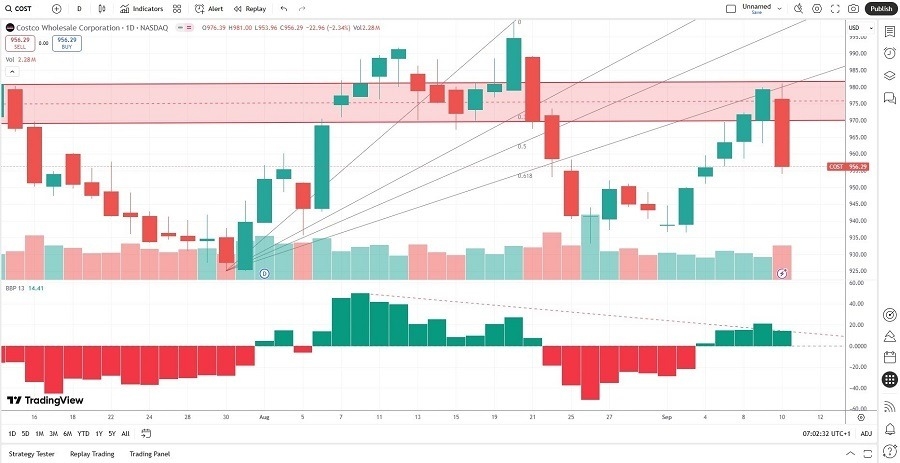
Short Trade Idea
Enter your short position between $953.96 (yesterday’s intra-day low) and $969.07 (the lower band of its horizontal resistance zone).
Market Index Analysis
- Costco Wholesale Corporation (COST) is a member of the NASDAQ 100, the S&P 100, and the S&P 500.
- All three indices are near all-time highs with bearish breakdown patterns emerging.
- The Bull Bear Power Indicator for the S&P 500 shows a negative divergence and does not confirm the uptrend.
Market Sentiment Analysis
Yesterday’s PPI report showed an unexpected contraction in producer prices for August, but investors will focus on today’s CPI release. Equity markets brushed off the better-than-expected reading yesterday, but Oracle stole the show and kept the AI hype alive with a blockbuster earnings report and future guidance. Today’s CPI report could determine how steeply the US Fed will slash interest rates.
Costco Wholesale Corporation Fundamental Analysis
Costco Wholesale Corporation is one of the world’s largest retailers and the biggest one for beef, poultry, organic produce, and wine. Over 30% of Americans shop at Costco Wholesale Corporation regularly, which drives value with its in-house brand. It currently has 905 warehouses serving more than 130 million members.
So, why am I bearish on COST after the most recent breakdown?
COST deals with slowing revenue growth and remains overvalued at current levels. I also worry about the weak gross margins that trail most competitors, leaving little room for operational errors. Costco Wholesale Corporation has increased its overall share count over the past five years, pays a meager dividend, and remains vulnerable to economic shocks.
Costco Wholesale Corporation Fundamental Analysis Snapshot
The price-to-earnings (P/E) ratio of 54.33 makes COST an expensive stock. By comparison, the P/E ratio for the S&P 500 is 30.30.
The average analyst price target for COST is $1,072.67. It suggests moderate upside potential as downside risks dominate.
Costco Wholesale Corporation Technical Analysis
Today’s COST Signal
Costco Price Chart
- The COST D1 chart shows price action breaking down below its horizontal resistance zone.
- It also shows price action breaking down below its ascending Fibonacci Retracement Fan.
- The Bull Bear Power Indicator is bullish with a descending trendline.
- The average bearish trading volumes are lower than the average bullish trading volumes during the recent advance, but overall higher during the preceding sell-off.
- COST corrected as the S&P 500 advanced, a significant bearish signal.
My Call on Costco
I am taking a short position in COST between $953.96 and $969.07. I believe the current breakdown will test the April lows. The weak operating margins do not fare well against the existing economic backdrop, and interest rate cuts will not solve the problem.
Top Regulated Brokers
- COST Entry Level: Between $953.96 and $969.07
- COST Take Profit: Between $871.71 and $897.67
- COST Stop Loss: Between $991.75 and $999.30
- Risk/Reward Ratio: 2.18
Ready to trade our free daily signals? Here is our list of the best brokers for trading worth reviewing


