
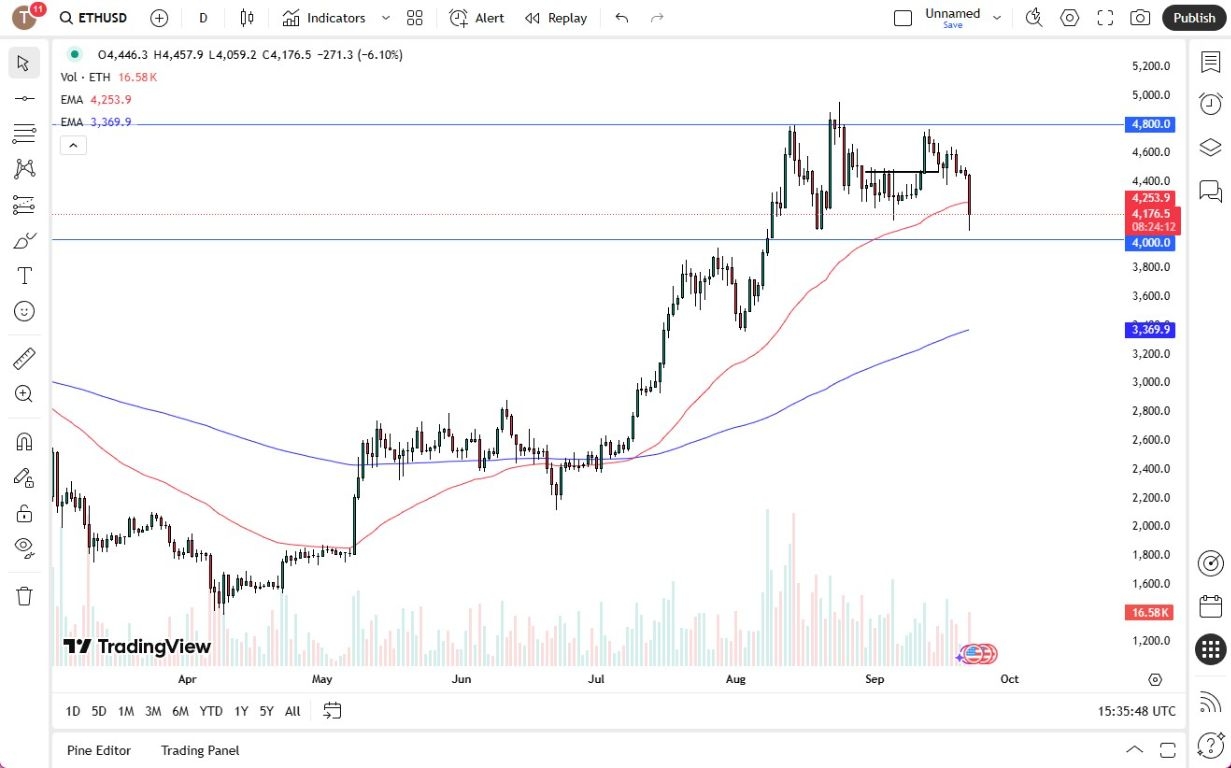
- Ethereum collapsed during the trading session on Monday, breaking below the 50 Day EMA, reaching the $4000 level. The $4000 level of course is a large, round, psychologically significant figure, and an area that we have seen a lot of support in previously.
- All things being equal, this is a market that continues to see a lot of reaction to risk appetite, and at this juncture, it’s probably worth noting that we have been in a range for some time. It’s an $800 rectangle that we find ourselves in, and therefore if and when we can break out of this rectangle, then we could see an $800 move based on “measured move” analysis.
Top Regulated Brokers
Technical Analysis and Support Holds
The technical analysis for this market is somewhat sideways, it is probably worth noting that the massive $4000 level has offered significant support, and it looks like we may even try to turn around a break above the 50 Day EMA. The size of the candlestick is obviously very negative in the volume of course is very impressive. In other words, this was a real sell off, and it’s probably worth noting that this could lead to something bigger. We have no idea what will happen next, but at this point in time it’s likely that we will have a bit of a question about the overall direction of the market. Quite frankly, if we give up $4000, that would be very bad for Ethereum and could send it plunging toward the 200 Day EMA.
On the other hand, if we do rally, and break above the $4500 level, that would be a very bullish sign for Ethereum. Breaking above the $4500 level opens up the possibility of a move to higher levels, including the $4800 level. Above the $4800 level, then you see Ethereum really start to take off to the upside. At that point, I don’t really see anything stopping the market from reaching the psychologically important $5000 level on that break out.
Ready to trade ETH? Here’s a list of some of the best crypto brokers to check out.