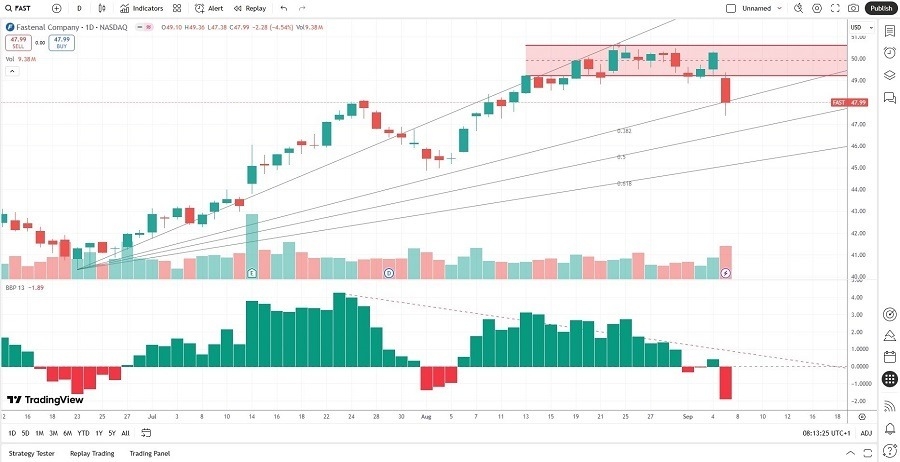
Short Trade Idea
Enter your short position between $47.38 (Friday’s intra-day low) and $48.37 (the lower band of its horizontal resistance zone).
Market Index Analysis
- Fastenal (FAST) is a member of the NASDAQ 100 and the S&P 500 indices.
- Both indices are near record highs, but bearish chart patterns have formed.
- The Bull Bear Power Indicator of the S&P 500 shows a negative divergence.
Market Sentiment Analysis
Friday’s NFP report confirmed a swiftly deteriorating labor market, but futures suggest a positive start to the week with inflation data front and center. Expectations call for a 25-basis-point interest rate this month, but it could be a one-and-done move, especially if inflation data surprises to the upside this week. Volatility could remain elevated this week as traders assess whether the weak economic data that they celebrated is too weak. Stagflation remains a primary threat that the markets often overlook.
Fastenal Fundamental Analysis
Fastenal is an industrial supply and stock-keeping unit with over 690,000 items. It refers to itself as a supply chain solutions company. It primarily caters to the construction and manufacturing sectors.
Top Regulated Brokers
So, why am I bearish on FAST after its breakdown?
The contraction in free cash flow margin is one reason I believe the breakdown could result in a correction for Fastenal, which trades at unjustifiable valuations. FAST burns cash to defend its market position as the economic outlook soured to stagflation conditions. The PEG ratio confirms limited upside ahead, and the current share price trades above the average analyst’s share price. FAST has also increased its overall share count over the past year, diluting existing shareholder value.
Metric | Value | Verdict |
P/E Ratio | 46.14 | Bearish |
P/B Ratio | 14.47 | Bearish |
PEG Ratio | 3.99 | Bearish |
Current Ratio | 4.22 | Bullish |
ROIC-WACC Ratio | Positive | Bullish |
The price-to-earnings (P/E) ratio of 46.14 makes FAST an expensive stock. By comparison, the P/E ratio for the S&P 500 is 28.97.
The average analyst price target for FAST is 43.85. It confirms that price action overshot its target with rising downside risks.
Fastenal Technical Analysis
Today’s FAST Signal

- The FAST D1 chart shows a breakdown below its horizontal resistance zone.
- It also shows price action challenging its ascending 38.2% Fibonacci Retracement Fan level.
- The Bull Bear Power Indicator turned bearish with a descending trendline.
- The average bearish trading volumes are higher than the average bullish trading volumes.
- FAST advanced with the S&P 500, but completed its breakdown, which is a bearish trading signal.
My Call on Fastenal
I am taking a short position in FAST between $47.38 and $48.37. Over the past two years, revenue growth has slowed, and free cash flow margins have been contracting. Valuations are high, confirmed by the PEG ratio, and I expect more downside following the breakdown amid stagflation economic conditions.
- FAST Entry Level: Between $47.38 and $48.37
- FAST Take Profit: Between $37.38 and $40.36
- FAST Stop Loss: Between $50.60 and $51.62
- Risk/Reward Ratio: 3.11
Ready to trade our free daily signals? Here is our list of the best brokers for trading worth checking out.
