
Short Trade Idea
Enter your short position between $313.27 (Friday’s intra-day low) and $319.43 (the upper band of its horizontal resistance zone).
Market Index Analysis
- McDonald’s (MCD) is a member of the Dow Jones Industrial Average, the S&P 100, and the S&P 500 indices.
- All three indices remain near record highs, but bearish chart patterns have formed.
- The Bull Bear Power Indicator of the S&P 500 shows a negative divergence.
Market Sentiment Analysis
Friday’s NFP report confirmed a swiftly deteriorating labor market, but futures suggest a positive start to the week with inflation data front and center. Expectations call for a 25-basis-point interest rate this month, but it could be a one-and-done move, especially if inflation data surprises to the upside this week. Volatility might remain elevated this week as traders assess the weak economic data that they celebrated as too weak. Stagflation remains a primary threat that the markets often overlook.
McDonald’s Fundamental Analysis
McDonald’s is a fast-food chain with the second-most locations globally. It is also a significant real estate owner and investor, and the second-largest private employer with over 1.7 million employees.
So, why am I bearish on MCD after it pushed higher?
While McDonald’s features a solid fundamental performance, it struggles with declining appetite from casual diners who prefer healthier options. Wage pressures continue to pose a threat, as evidenced by declining revenues and earnings per share. The promotions to keep in-store foot traffic from falling off a cliff could show up in its next earnings call. Valuations compared to its peers are high, further highlighted by its PEG ratio, which confirms an overvalued company.
Metric | Value | Verdict |
P/E Ratio | 26.96 | Bearish |
P/B Ratio | Unavailable | Bearish |
PEG Ratio | 2.59 | Bearish |
Current Ratio | 1.30 | Bearish |
ROIC-WACC Ratio | Positive | Bullish |
The price-to-earning (P/E) ratio of 26.96 makes MCD an expensive stock. By comparison, the P/E ratio for the S&P 500 is 28.97.
The average analyst price target for MCD is 335.41. It suggests moderate upside potential, but downside risks are rising.
McDonald’s Technical Analysis
Today’s MCD Signal
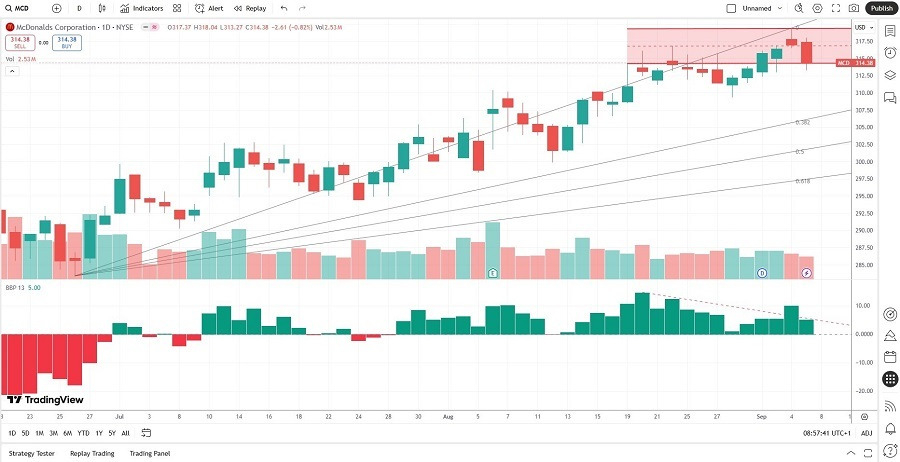
- The MCD D1 price chart above shows price action inside a horizontal resistance zone.
- It also shows price action between its ascending 0.0% and 38.2% Fibonacci Retracement Fan levels.
- The Bull Bear Power Indicator is bullish but shows a negative divergence.
- The average bearish trading volumes are higher than the average bullish trading volumes.
- MCD advanced with the S&P 500, but bearish conditions have risen.
Top Regulated Brokers
My Call on McDonald’s
I am taking a short position in MCD between $313.27 and $319.43. I predict a breakdown in MCD driven by weakening fundamentals, and I will follow its core consumer to healthier choices, with soups the latest fast dining hype.
- MCD Entry Level: Between 313.27 and 319.43
- MCD Take Profit: Between 276.53 and 283.47
- MCD Stop Loss: Between 325.82 and 335.41
- Risk/Reward Ratio: 2.93
Ready to trade our free daily signals? Here is our list of the best brokers for trading worth checking out.