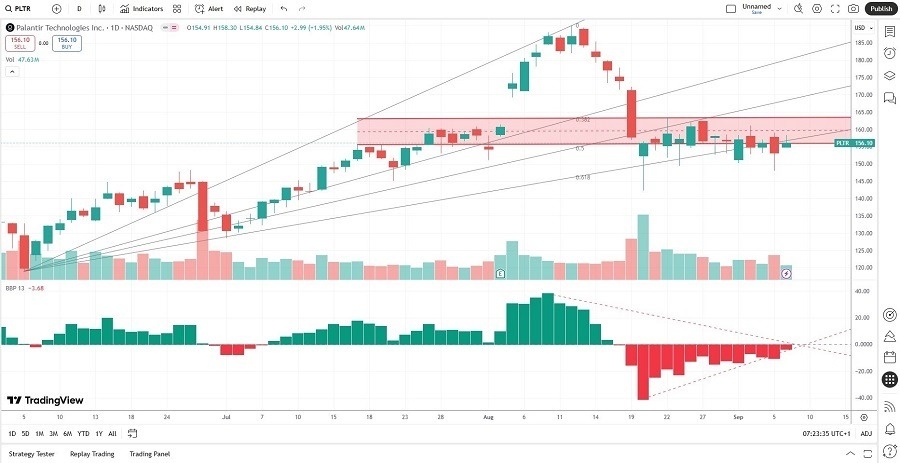
Short Trade Idea
Enter your short position between $148.04 (the intra-day low of its last bearish candlestick) and $158.30 (yesterday’s intra-day high).
Market Index Analysis
- Palantir (PLTR) is a member of the NASDAQ 100, the S&P 100, and the S&P 500.
- All three indices are near all-time highs, but bearish conditions are on the rise.
- The Bull Bear Power Indicator shows a negative divergence and does not confirm the uptrend.
Market Sentiment Analysis
Equity futures were in the green, as markets began to “price in” a 50-basis-point interest rate cut, given that labor market data is worse than initially feared. Economists expect that the employment growth for the 12 months ending in March to show downward revisions of up to 1,000,0000 jobs. Interest rate cuts will not slow down the current labor trend, driven by AI, high labor costs, and uncertain economic conditions created partially by the current tariff regime. This week’s CPI and PPI data will provide crucial data on inflation.
Palantir Fundamental Analysis
Palantir is a software-as-a-service (SaaS) tech company and a leading US artificial intelligence player. It counts the intelligence and defense sectors as significant clients, and its share price rode the AI hype higher.
So, why am I bearish on PLTR after its price target upgrade?
While I believe in the long-term upside of Palantir and rate it among the most exciting AO plays, current valuations remain excessive. The return on invested capital is below the cost of capital. PLTR is destroying shareholder value. Stagflationary conditions are rising, which could lower revenues from the non-defense sector. The PEG ratio confirms an overvalued stock, and the double-digit percentage correction has more room to run.
The price-to-earnings (P/E) ratio of 520.33 makes PLTR an expensive stock. By comparison, the P/E ratio for the NASDAQ 100 is 31.83.
The average analyst price target for PLTR is $151.74. This suggests no upside potential, while short-term downside risks remain.
Palantir Technical Analysis
Today’s PLTR Signal
Palantir Price Chart
- The PLTR D1 chart shows price action below its horizontal resistance zone, and the formation of a bearish head-and-shoulders chart pattern.
- It also shows price action breaking down below its ascending 61.8% Fibonacci Retracement Fan level.
- The Bull Bear Power Indicator has been bearish for 15 trading sessions.
- The average bearish trading volumes are higher than the average bullish trading volumes.
- PLTR corrected as the the NASDAQ 100 index advanced, a significant bearish trading signal.
My Call on Palantir
Top Regulated Brokers
I am taking a short position in PLTR between $148.04 and $158.30. I believe the head-and-shoulders pattern will result in a breakdown and correction. Valuations remain excessive, even considering the expected revenue growth, as confirmed by the PEG ratio. I am a short-term seller.
- PLTR Entry Level: Between $148.04 and $158.30
- PLTR Take Profit: Between $105.32 and $118.93
- PLTR Stop Loss: Between $169.22 and $181.92
- Risk/Reward Ratio: 2.02
Ready to trade our free daily signals? Here is our list of the best brokers for trading worth checking out.


