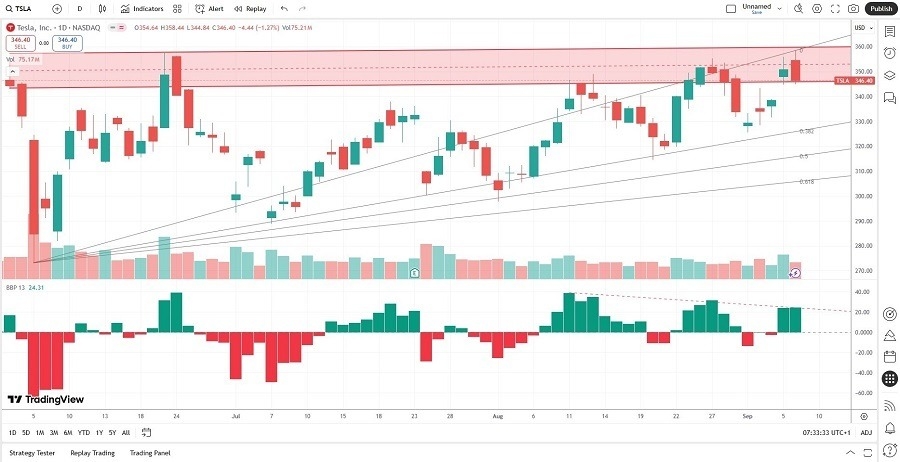
Short Trade Idea
Enter your short position between $344.84 (the lower band of its horizontal resistance zone) and $358.44 (yesterday’s intra-day high).
Market Index Analysis
- Tesla (TSLA) is a member of the NASDAQ 100, the S&P 100, and the S&P 500 indices.
- All three indices are near all-time highs, but bearish conditions are on the rise.
- The Bull Bear Power Indicator shows a negative divergence and does not confirm the uptrend.
Market Sentiment Analysis
Equity futures were in the green, as markets began to price-in a 50-basis-point interest rate cut, given that labor market data is worse than initially feared. Economists expect that employment growth for the 12 months ending in March will show downward revisions of up to 1,000,0000 jobs. Interest rate cuts will not slow down the current labor trend, driven by AI, high labor costs, and uncertain economic conditions created partially by the current tariff regime. This week’s CPI and PPI data will provide crucial data on inflation.
Tesla Fundamental Analysis
Tesla is one of the world’s most valuable companies by market capitalization, but it faces stiff competition from Chinese rivals. The pending US Senate Megabill will make companies like Tesla less profitable, as the company already struggles with declining market share and shrinking profit margins.
So, why am I bearish on TSLA after its recent advance?
High valuations stand out, but I also think that Tesla will struggle with its identity for a bit. It is known as an automobile assembler, but it began to push into the AI sphere at a time when it struggled to sell cars. Competition, particularly from China, will continue to threaten its revenue potential in the medium term. The PEG ratio suggests an overvalued company, profit margins are shrinking along with revenues, and the current share price has overshot analyst’s expectations by nearly 10%.
The price-to-earning (P/E) ratio of 206.19 makes TSLA an expensive stock. By comparison, the P/E ratio for the NASDAQ 100 is 31.83.
The average analyst price target for TSLA is 310.53. It suggests no upside potential with rising bearish catalysts.
Tesla Technical Analysis
Tesla Price Chart
- The TSLA D1 chart shows price action inside its horizontal resistance zone at the verge of a breakdown, and the formation of a double top.
- It also shows price action trading between its ascending 0.0% and 38.2% Fibonacci Retracement Fan levels.
- The Bull Bear Power Indicator is bullish with a negative divergence.
- The average bearish trading volumes are higher than the average bullish trading volumes.
- TSLA advanced with NASDAQ 100 but shows rising bearish catalysts.
My Call on Tesla
I am taking a short position in TSLA between $344.84 and $358.44. Tesla maintains excellent long-term potential with its push into advanced chips, which will take time to deliver results. In the medium term, core markets have scrapped subsidies for electric vehicles, profit margins are shrinking, and competitors produce better cars for less money.
- TSLA Entry Level: Between $344.84 and $358.44
- TSLA Take Profit: Between $273.21 and $288.77
- TSLA Stop Loss: Between $365.61 and $376.58
- Risk/Reward Ratio: 3.45
Ready to trade our free daily signals? Here is our list of the best brokers for trading worth checking out.


