
Shrinking profit margins, a dismal return on invested capital, and slowing revenues hint at more issues ahead. Did earnings manifest a bearish case?
Top Regulated Brokers
Short Trade Idea
Enter your short position between 79.41 (the lower band of its horizontal resistance zone) and 83.01 (the upper band of its horizontal resistance zone).
Market Index Analysis
- Xcel Energy (XEL) is a member of the NASDAQ 100 and the S&P 500
- Both indices have entered a bearish price channel and are moving away from all-time highs with rising bearish volumes
- The Bull Bear Power Indicator of the S&P 500 is bearish with a descending trendline
Market Sentiment Analysis
Equity markets extended the AI-led sell-off from last week, with futures pointing to more downside ahead of tomorrow’s NVIDIA earnings after the bell. Markets also slashed expectations for a December interest rate cut from above 90% to 40%, further applying downside pressure on tech names, as they often rely on debt to finance business expansions. Adding to the sour mood is the bear market in Bitcoin and the impact on investor confidence, especially in the retail sector. While it remains premature to call the AI bubble bursting, red flags continue to amass.
Xcel Energy Fundamental Analysis
Xcel Energy is a US-regulated electric utility and natural gas company with four subsidiaries serving Colorado, Minnesota, Wisconsin, Michigan, North Dakota, South Dakota, Texas, and New Mexico. It is also a major player in the green energy transition.
So, why am I bearish on XEL following its earnings report?
Third-quarter earnings came in at $524 million, or $0.88 per share, versus $682 million and $1.21 in the same period one year ago. Profit margins continued to decline, and Xcel Energy announced a $60 billion five-year spending plan. I remain bearish on its below-average growth rates, contracting margins, and rising capital expenditures. XEL banks 60% of its revenue growth until 2030 from data center demand, exposing it to the AI bubble.
Xcel Energy Fundamental Analysis Snapshot
Metric | Value | Verdict |
P/E Ratio | 24.79 | Bearish |
P/B Ratio | 2.25 | Bullish |
PEG Ratio | 2.98 | Bearish |
Current Ratio | 0.79 | Bearish |
ROIC-WACC Ratio | Negative | Bearish |
The price-to-earnings (P/E) ratio of 24.79 indicates that XEL is expensive relative to its industry. By comparison, the P/E ratio for the S&P 500 is 30.27.
The average analyst price target for XEL is 89.47, which suggests modest upside potential, while downside pressure is rising.
Xcel Energy Technical Analysis
Today’s XEL Signal
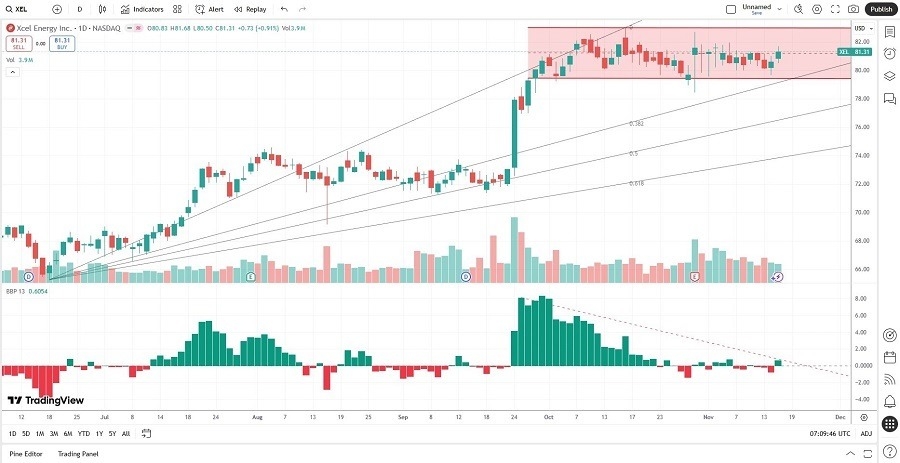
- The XEL D1 chart shows price action inside a horizontal resistance zone
- It also shows price action between its ascending 0.0% and 38.2% Fibonacci Retracement Fan levels
- The Bull Bear Power Indicator turned bullish with a descending trendline
- The average bearish trading volumes are higher than the average bullish trading volumes
- XEL trended sideways as the S&P 500 moved lower, but bearish catalysts have emerged
My Call
I am taking a short position in XEL between 79.41 and 83.01. High valuations, shareholder dilution, the Texas AG’s probe, falling profit margins, a lowered dividend, and dismal operational metrics drive my bearish case.
- XEL Entry Level: Between 79.41 and 83.01
- XEL Take Profit: Between 62.58 and 65.21
- XEL Stop Loss: Between 85.82 and 88.47
- Risk/Reward Ratio: 2.63
Ready to trade our analysis of Xcel Energy? Here is our list of the best stock brokers worth checking out.