
Bearish view
- Sell the BTC/USD pair and set a take-profit at 70,000.
- Add a stop-loss at 75,000.
- Timeline:1-2 days.
Bullish view
- Buy the BTC/USD pair and set a take-profit at 75,000.
- Add a stop-loss at 70,000.
The BTC/USD pair continued its freefall in the overnight session as investors dumped risky assets after talks between Iran and US stalled. Bitcoin price dropped to a low of $71,735, much lower than the all-time high of 126,300.
Top Regulated Brokers
Bitcoin Price Crash Continues as Risk-off Sentiment Prevails
The BTC/USD pair continued falling after a report by Axios confirmed that talks between Iran and the United States had stalled, meaning that there is a risk of a full war in the region.
Bitcoin price would underperform the market if there were a war because it has lost its role as a safe-haven asset. The rising risk explains why gold and crude oil prices have continued rising this week.
The BTC/USD pair continued falling as investors continued to stay on the sidelines. For example, data compiled by CoinGlass shows that the futures open interest in the crypto industry dropped to $104 billion from last year's high of $255 billion. This figure has been falling since the October 10 liquidation event when over $20 billion were wiped out in a day.
The ongoing Bitcoin crash has continued as many leveraged traders were liquidated. Bitcoin positions worth over $1.5 billion have been liquidated this month. At the same time, investors have dumped ETF assets worth millions of dollars.
The BTC/USD pair has crashed as the Crypto Fear and Greed Index moved to the extreme fear zone of 14. In most cases, a falling figure is a sign that fear is spreading. On the positive side, crypto rallies start whenever this figure slips to the extreme fear zone.
BTC/USD Technical Analysis
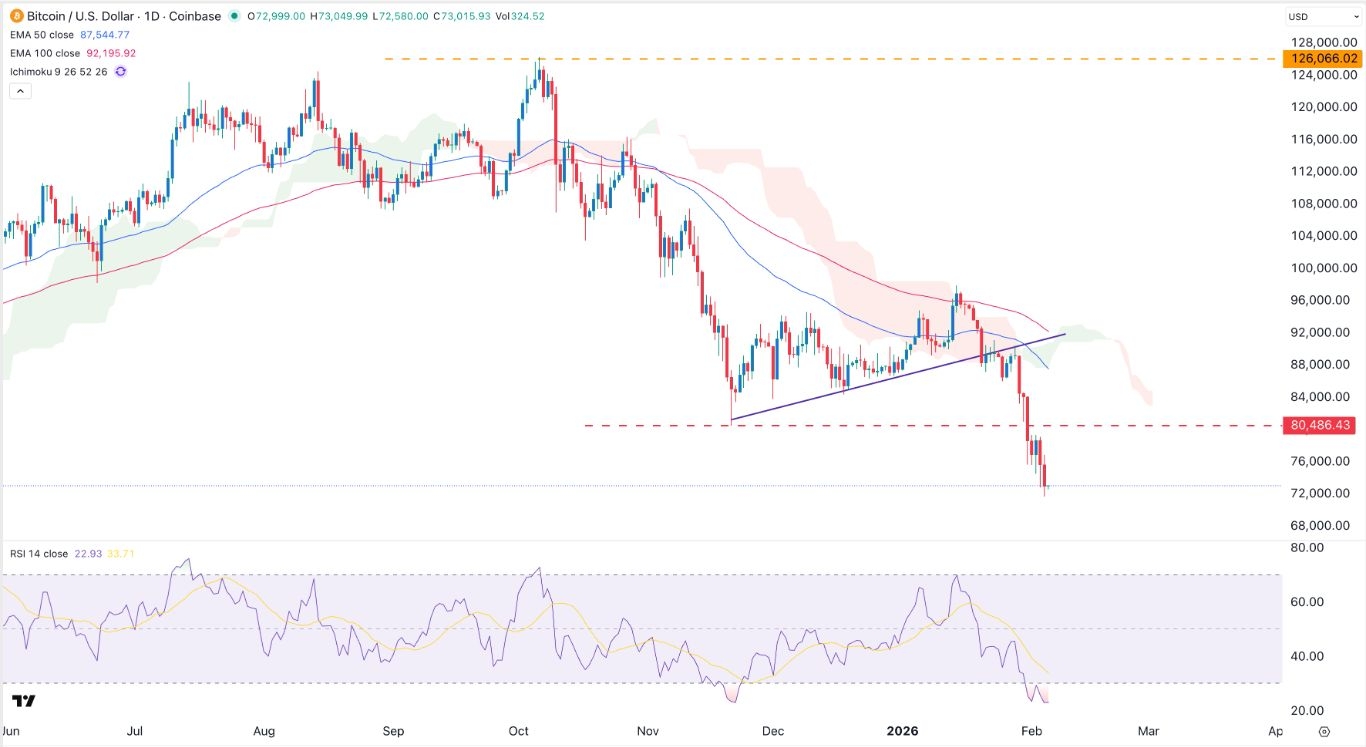
The daily timeframe chart shows that the BTC/USD pair has been in a strong downward trend, moving from a high of 126,300 in October last year to the current 72,850. It recently crashed below the key support level at 80,486, its lowest level in November last year.
The BTC/USD pair has continued falling below the 50-day and 100-day Exponential Moving Averages (EMA) and the Supertrend indicator. At the same time, the Relative Strength Index (RSI) has moved to the extreme oversold of 22. The two lines of the Stochastic Oscillator have also moved below the oversold level.
Therefore, the BTC/USD pair will likely continue falling as sellers target the key support level at 70,000. On the other positive side, rebounds normally happen when the Fear and Greed Index moves to the extreme fear zone and when the coin gets highly oversold.
Ready to trade our free Forex signals? Here are the best MT4 crypto brokers to choose from.