

Bearish view
- Sell the BTC/USD pair and set a take-profit at 64,000.
- Add a stop-loss at 72,000.
- Timeline: 1-2 days.
Bullish view
- Buy the BTC/USD pair and set a take-profit at 72,000.
- Add a stop-loss at 64,000.
Bitcoin price was stuck in a tight range on Monday, continuing a consolidation phase that has been going on for weeks. The BTC/USD pair was trading at 68,430 on Monday, down sharply from the all-time high of 126,200.
Bitcoin is Facing Major Challenges
The BTC/USD pair wavered inside a narrow range as the coin continued facing major challenges. For example, data compiled by SoSoValue shows that spot Bitcoin ETFs shed over $315 million in assets, bringing the monthly outflow to over $993 million.
These funds have now lost over $6 billion in the past few months, bringing the cumulative total net inflows since their inception to $54 billion. The funds now hold over $85 billion in assets, with BlackRock's IBIT having over $51 billion in assets.
Bitcoin price has also struggled as demand from Digital Asset Treasury companies has waned. Only a handful of companies, including Strategy and Strive, are accumulating Bitcoin.
Meanwhile, Bitcoin’s role in portfolios is being questioned as the consolidation continues. For example, its role as a safe-haven has not worked as it has remained amid rising risks. Instead, gold has jumped to a record high, and ETF inflows have soared.
Bitcoin has also not worked well as an inflation and a currency debasement hedge, while gold and silver prices have soared.
Bitcoin reacted mildly to the Supreme Court’s decision on Donald Trump's tariffs on Friday. The court ruled that the tariffs were illegal, pushing the president to implement a new 15% global tariff.
Meanwhile, data compiled by CoinGlass shows that Bitcoin’s futures open interest has dropped sharply in the past few months, moving from last year's high of $95 billion to the current $40 billion.
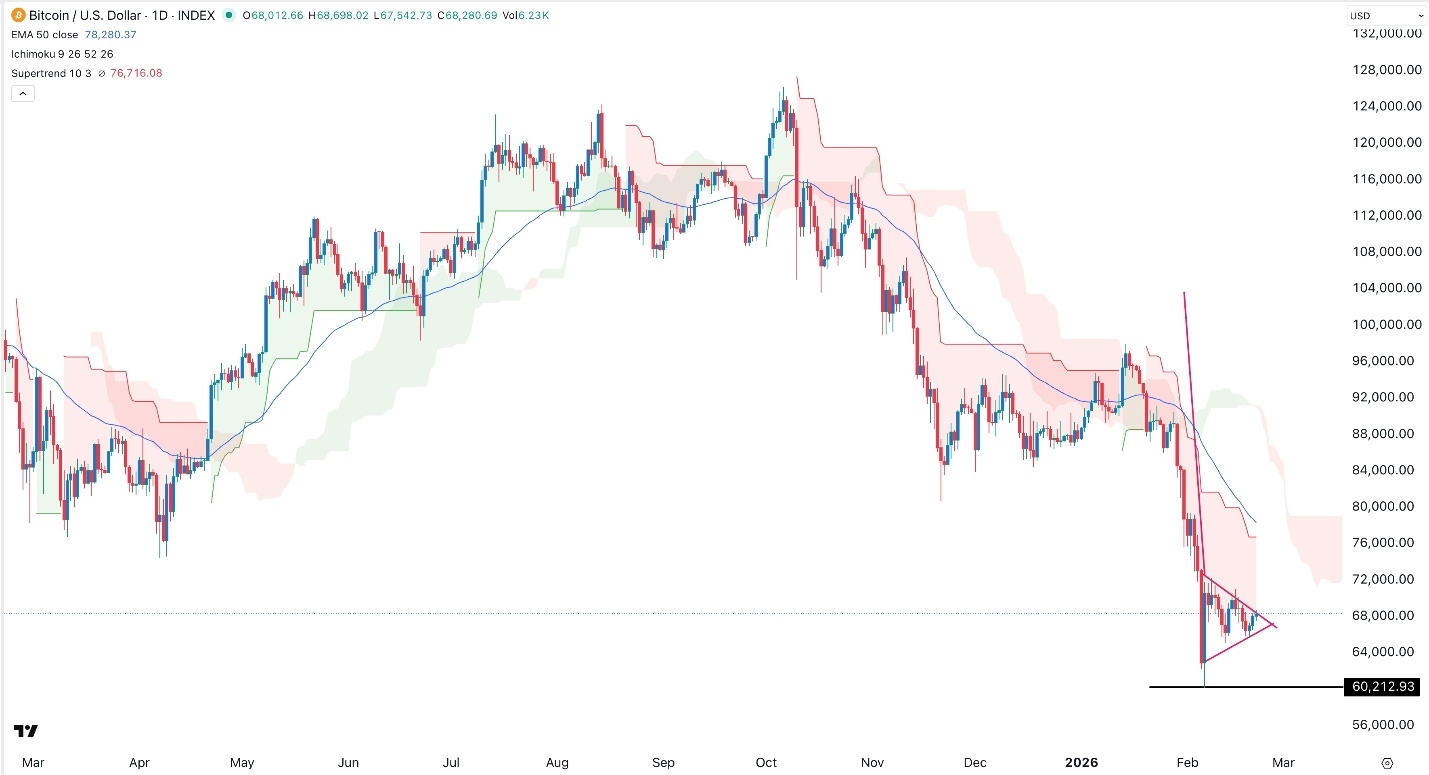
BTC/USD Technical Analysis
The daily timeframe chart shows that the BTC/USD pair has come under pressure in the past few months, moving from a record high of 126,300 in October last year to the current 68,300.
It has remained below the 50-day Exponential Moving Average (EMA). Also, it has dropped below the Ichimoku cloud indicator. It also remains below the Supertrend indicator, a sign that bears are in control.
The pair has formed a bearish pennant pattern, which is made up of a vertical line and a symmetrical triangle. Therefore, the pair will likely resume the downward trend, potentially to the key support level at 60,000, its lowest level this year.