
Bullish view
Buy the BTC/USD pair and set a take-profit at 74,000.
Add a stop-loss at 64,000.
Timeline: 1-2 days.
Bearish view
Sell the BTC/USD pair and set a take-profit at 64,000.
Add a stop-loss at 74,000.
Bitcoin price steadied near the important level at $70,000. The BTC/USD pair was trading at 69,000, inside a range it has been in the past 30 days. It remains much lower than the all-time high of 126,300.
Bitcoin Steady Despite Rising Risks
The BTC/USD pair moved sideways on Tuesday despite the ongoing crisis in the Middle East that has pushed energy prices to the highest point in years.
Brent crude oil initially jumped to $119 on Monday and then pulled back to $90. This performance happened even as G7 countries decided against releasing oil from the Strategic Oil Reserves.
Bitcoin price rose as investors predicted that the war may end soon. A Washington Post report noted that Israeli officials were getting concerned as the war continued.
Analysts also expect that Donald Trump will TACO on his war in Iran as the stock market drops and energy prices remain elevated.
This explains why the US stock market erased its earlier losses and then bounced back. The Dow Jones rose by 210, while the S&P 500 and Nasdaq 100 indices rose by 0.70% and 1.20%, respectively.
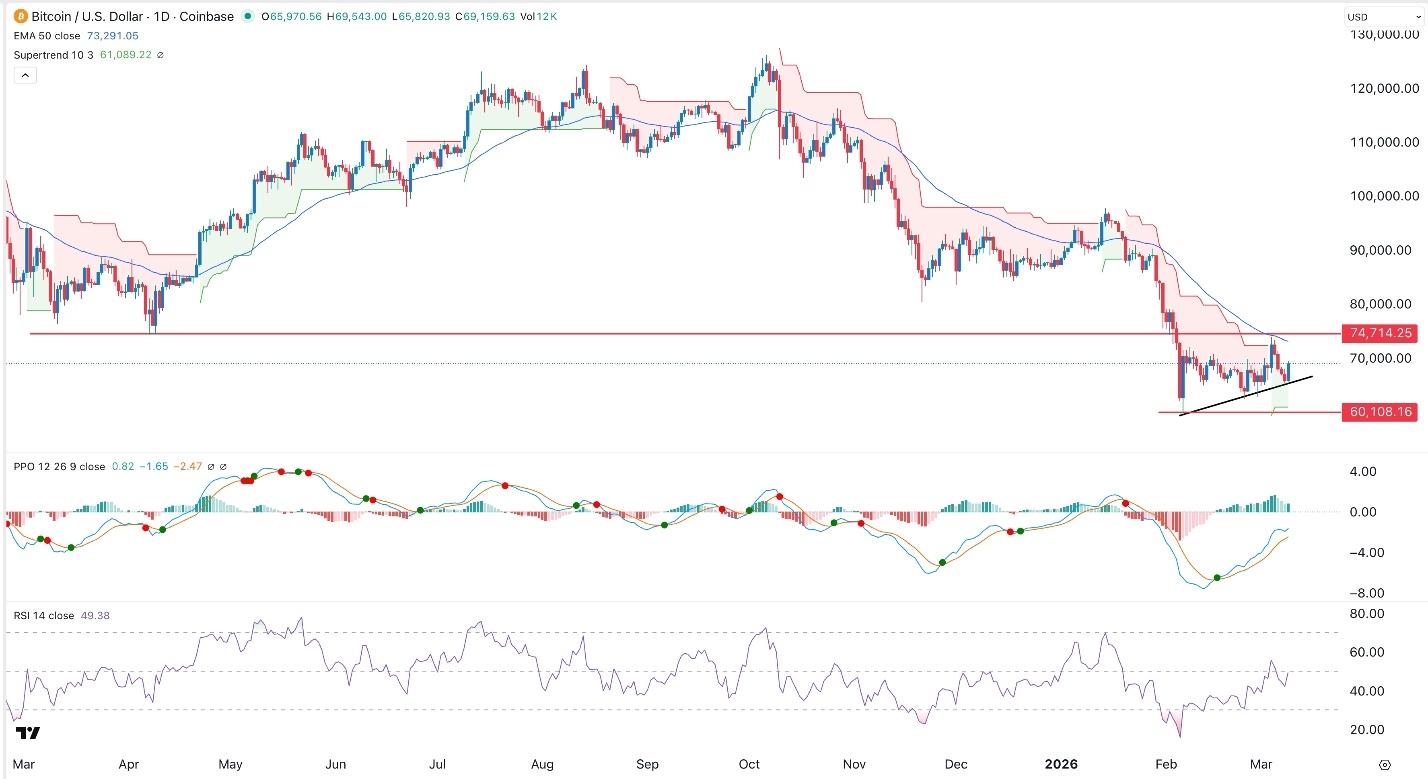
BTC/USD Technical Analysis
The daily timeframe chart shows that Bitcoin price has rebounded from the year-to-date low of $60,100 to the current $69,000.
It has remained above the ascending trendline, which connects the lowest swings on February 5 and 24. It was also the lowest swing on March 8.
The Percentage Price Oscillator (PPO) has continued rising, moving from the year-to-date low and is nearing the zero line. Also, the Relative Strength Index (RSI) has jumped from the oversold level at 15 to the current 50 and is pointing upwards.
Bitcoin is attempting to move above the 50-day Exponential Moving Average (EMA). It has already flipped the Supertrend indicator from red to green.
Therefore, the most likely scenario is where the pair continues rising in the coming days, potentially to the key resistance level at 74,000. On the flip side, a drop below the key support level at 64,000 will invalidate the bullish outlook.