
Bearish view
Sell the EUR/USD pair and set a take-profit at 1.1412.
Add a stop-loss at 1.1650.
Timeline: 1-2 days.
Bullish view
Buy the EUR/USD pair and set a take-profit at 1.1650.
Add a stop-loss at 1.1412.
The EUR/USD exchange rate dropped for four consecutive days as the US-Iran war escalated, pushing more investors to the safety of the greenback. It dropped to 1.1510 on Monday, down substantially from the year-to-date high of 1.2082.
US-Iran War Has Escalated
The EUR/USD pair remained on edge as signs that the US-Iran war will escalate continued. Thousands of US military officers are expected to arrive in the Middle East, with the US considering a ground invasion.
At the same time, Yemen’s Houthi rebels entered the war, which may lead to disruption of trade in the Red Sea. As a result, energy prices have continued soaring, with Brent and West Texas Intermediate (WTI) remaining above $100.
The implication of all this is that the US and European inflation will continue rising in the coming months, especially when the war continues for longer than expected.
For example, a report coming out today, March 30, is expected to show that the German economy rose to 2.6% in March from 1.9% in the previous month. The harmonized inflation rate is expected to come in at 2.7%, up from the previous 2.0%.
A report released by the OECD last week showed that the headline European consumer inflation will average over 3% this year.
The same is happening in the United States, where inflation has remained above the 2% target in the past few months. OECD expects that the US consumer inflation will rise to over 4% this year if energy prices continue rising.
The next key catalyst for the EUR/USD pair will be the upcoming US consumer confidence report on Tuesday. Economists expect the data to show that consumer confidence tumbled to 88 this month from 91.2 in the previous month.
EUR/USD Technical Analysis
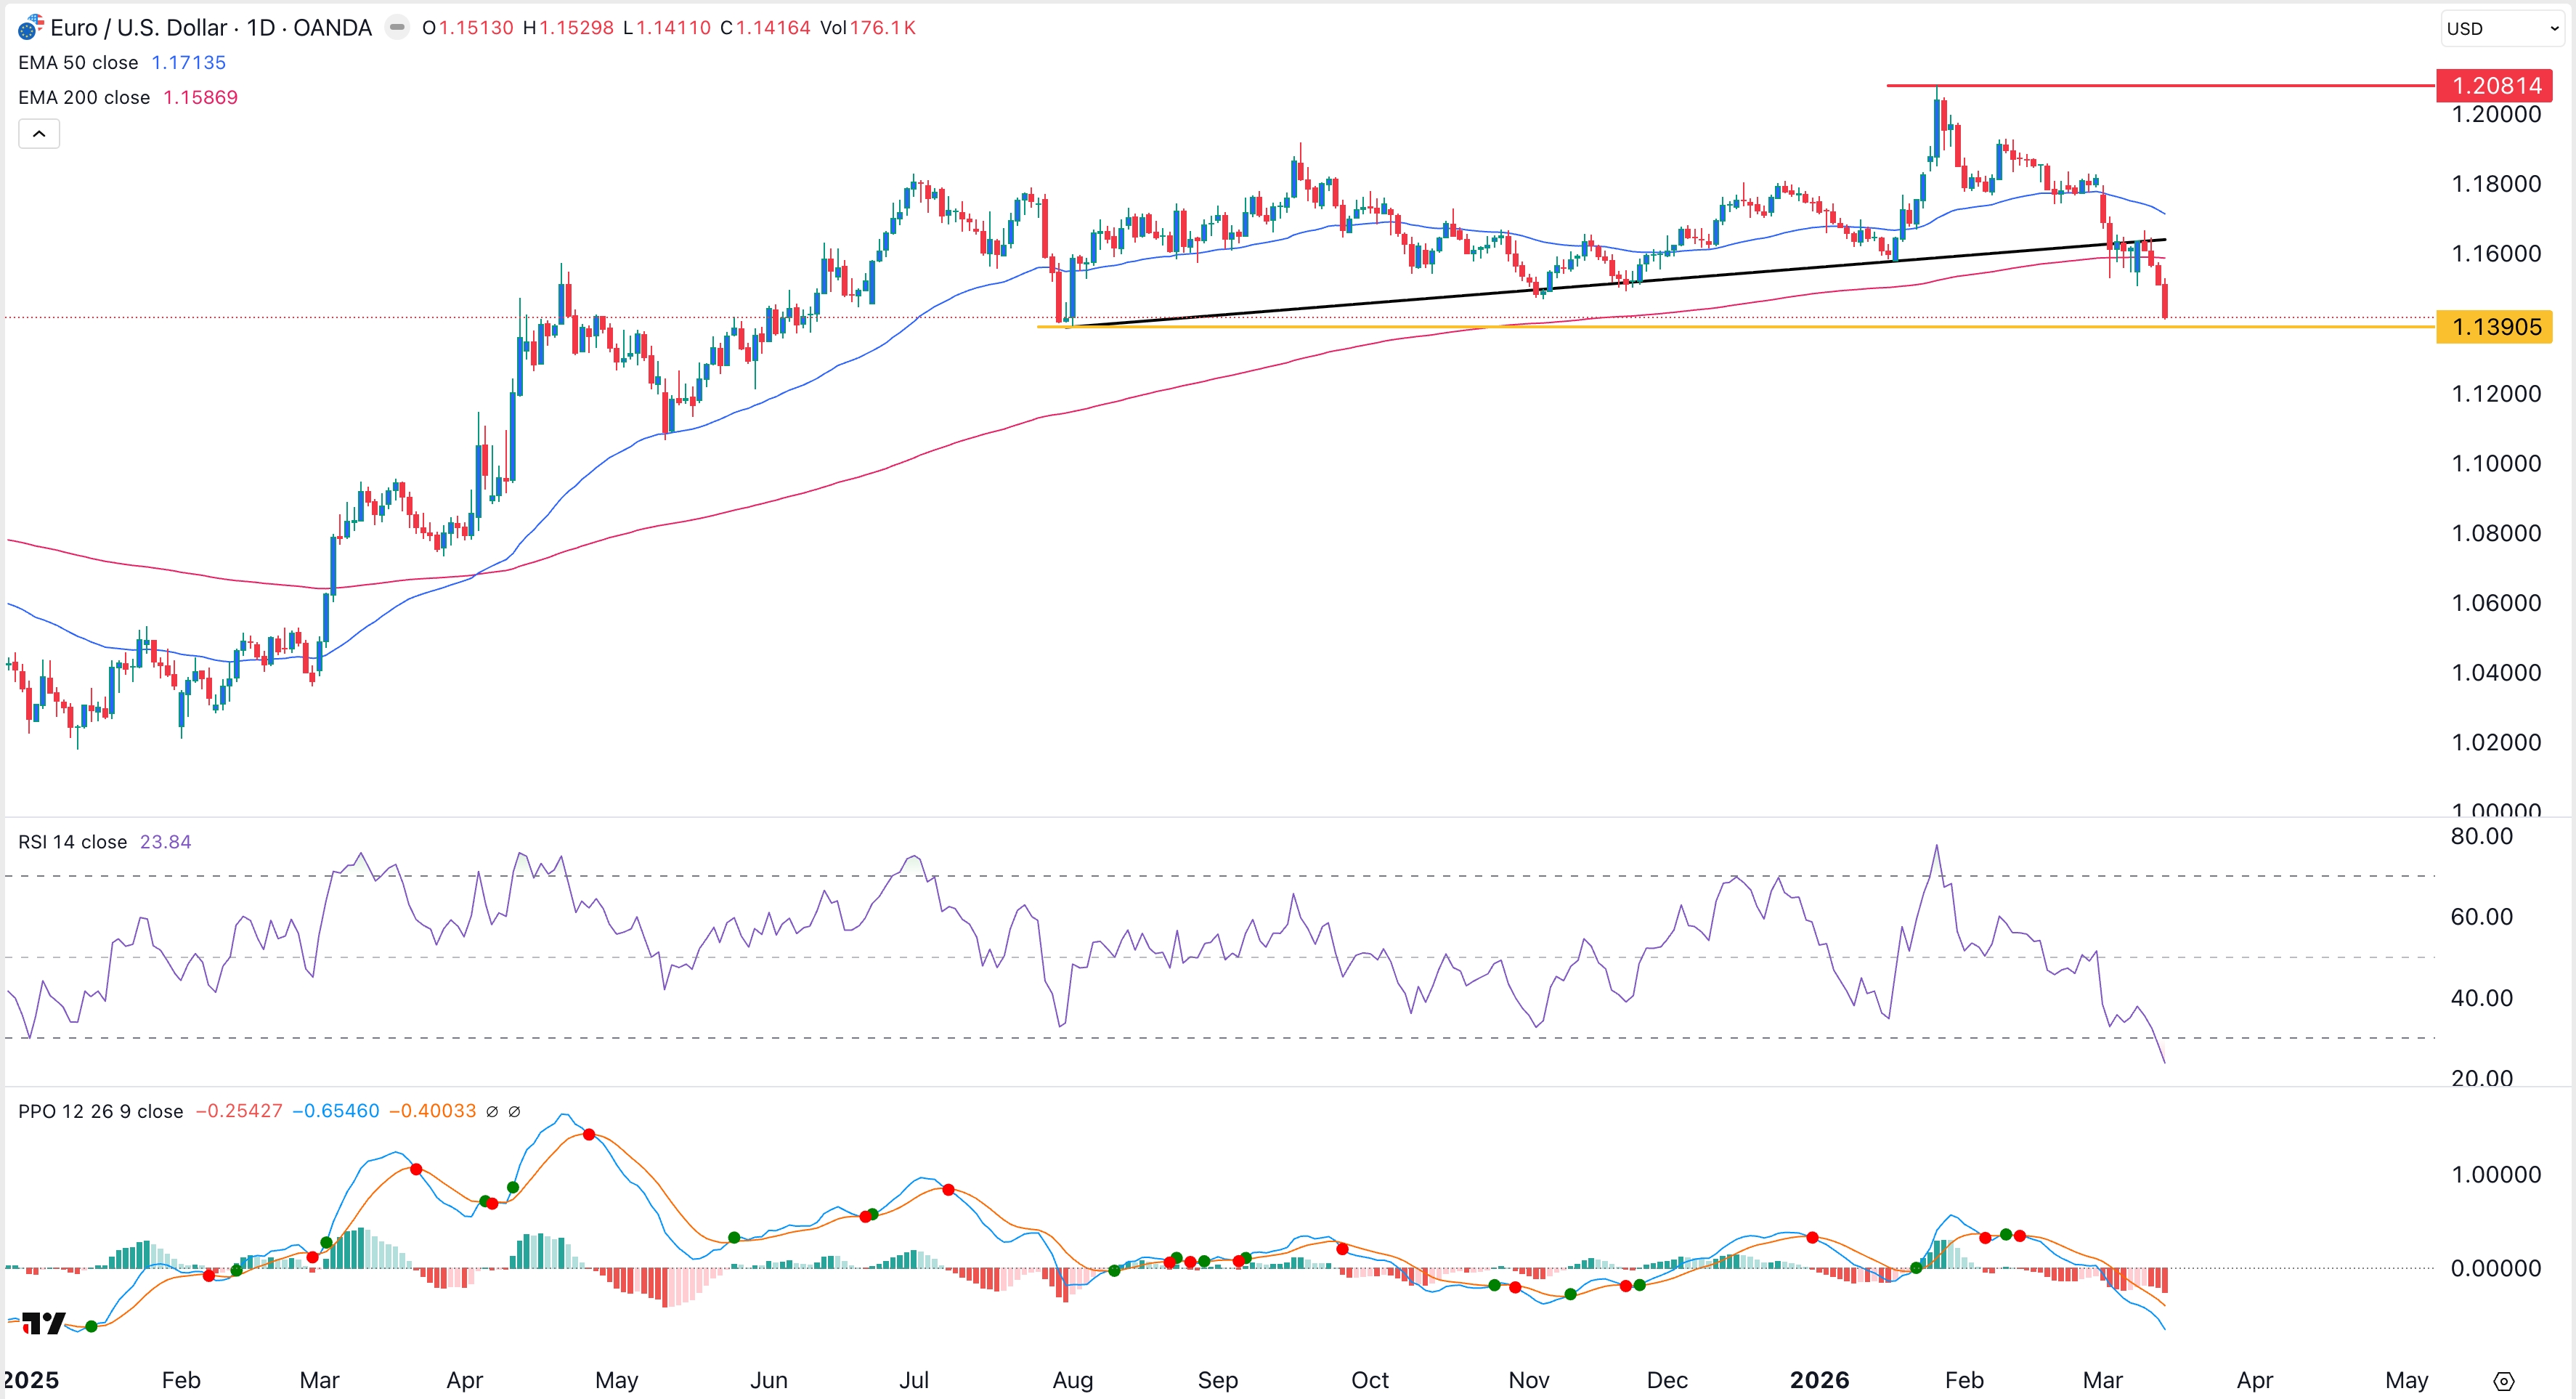
The daily chart shows that the EUR/USD exchange rate has dropped in the past few months, moving from a high of 1.2090 in January to the current 1.1510.
It has moved below the rising channel, which is part of the bearish flag pattern, a common continuation sign in technical analysis. The Relative Strength Index (RSI) has dropped to 40, while the Average Directional Index (ADX) has fallen to 34.
The 50-day and 100-day Exponential Moving Averages (EMA) have formed a bearish crossover pattern, confirming the bearish outlook.
Therefore, the pair will likely continue falling as bears target the key support level at 1.1412, its lowest level this month. A move below that level will point to more downside, potentially to the psychological level at 1.1300.