
My previous BTC/USD signal on 30th March may have produced a losing short trade from the bearish rejection of the resistance level at $67,715.
Today’s BTC/USD Signals
Risk 0.50% per trade.
Trades must be taken prior to 5pm Tokyo time Thursday.
Long Trade Ideas
Go long after a bullish price action reversal on the H1 timeframe following the next touch of $72,557, $71,887, or $70,323.
Place the stop loss $100 below the local swing low.
Move the stop loss to break even once the trade is $100 in profit by price.
Take off 50% of the position as profit when the trade is $100 in profit by price and leave the remainder of the position to ride.
Short Trade Idea
Go short after a bullish price action reversal on the H1 timeframe following the next touch of $81,203
Place the stop loss $100 above the local swing high.
Adjust the stop loss to break even once the trade is $100 in profit by price.
Take off 50% of the position as profit when the trade is $100 in profit by price and leave the remainder of the position to ride.
The best method to identify a classic “price action reversal” is for an hourly candle to close, such as a pin bar, a doji, an outside or even just an engulfing candle with a higher close. You can exploit these levels or zones by watching the price action that occurs at the given levels.
BTC/USD Analysis
In my last BTC/USD forecast a little more than two weeks ago, I had through that if the price got established above $67,715 it would continue to rise to $69,234. This was a good and profitable call.
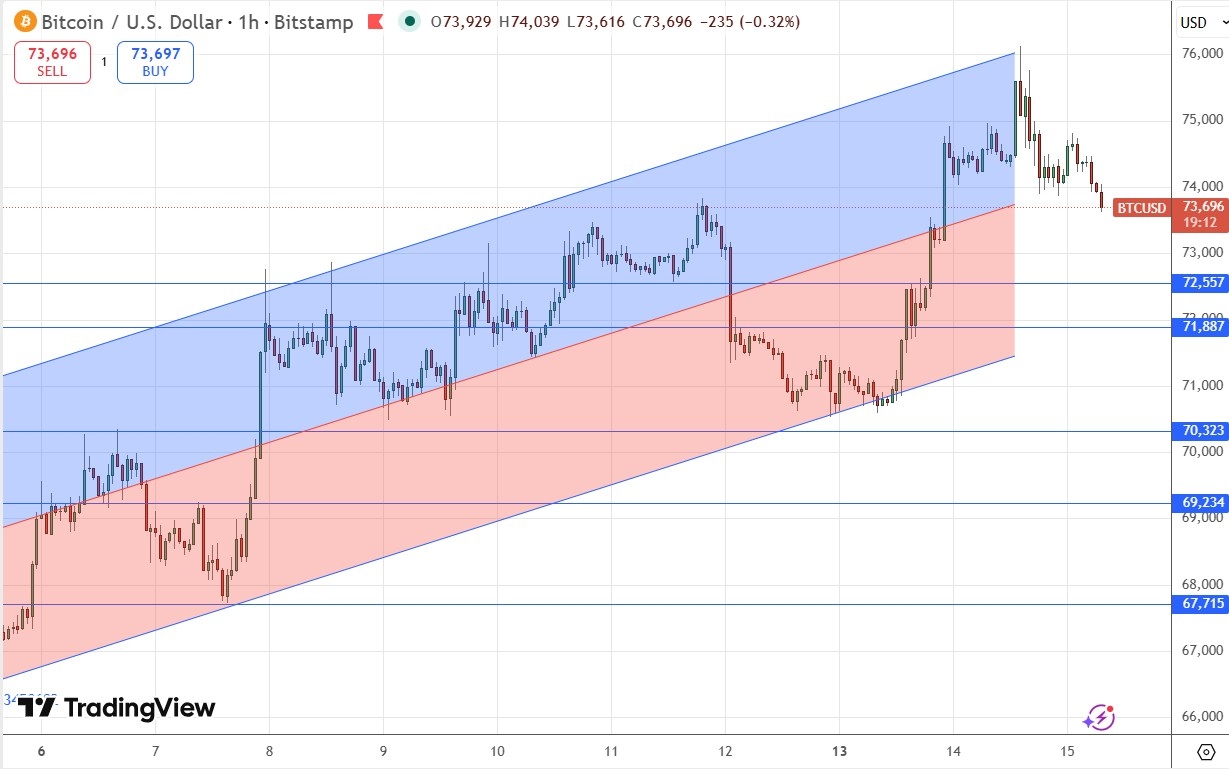
Bitcoin has been boring for quite a while after falling dramatically from record highs last year. However, this started to change earlier this week as the price started to finally make a significant bullish breakout to new highs beyond $75,000 which has held the price for a long time as an area of resistance. Yet the breakout quickly failed, and the price is moving lower with short-term bearish momentum as we see the price get below the bearish head and shoulders neckline at about $74,000.
Despite these bearish signs, the price is still easily contained within an ascending price channel, which is presented as a linear regression analysis within the price chart below. This suggests that the technical picture remains basically bullish.
Due to the ascending price channel, I think any bullish bounce at either of the two nearest support levels could be an interesting long trade, although you might need to be conservative with taking profits. However, if the price later succeeds in breaking to new highs, it will be worth remembering that the price can rise all the way to $81,203 without meeting resistance.
https://www.tradingview.com/chart?symbol=COINBASE%3ABTCUSD
There is nothing of high importance due today regarding either Bitcoin or the US Dollar.
Ready to trade our free Forex signals? Here is our list of the best MT4 crypto brokers worth checking out.