
Bearish view
Sell the BTC/USD pair and set a take-profit at 70,000.
Add a stop-loss at 80,000.
Timeline: 1-2 days.
Bullish view
Buy the BTC/USD pair and set a take-profit at 80,000.
Add a stop-loss at 70,000.
Bitcoin price lost momentum this week after facing substantial rejection at the important resistance level at $79,360. The BTC/USD pair dropped to 75,985 as focus shifted to the upcoming Federal Reserve interest rate decision later today.
Bitcoin Price Slips as Demand Stalls
The BTC/USD pair retreated for the second consecutive day as the recent rally lost momentum. Data shows that spot Bitcoin ETFs have shed assets this week after adding billions of dollars earlier this month.
The retreat coincided with the ongoing drop in the stock market, with the S&P 500 and Nasdaq 100 indices falling by over 0.65%. At the same time, the US dollar index rose modestly on Tuesday.
This price action happened as crude oil prices continued rising, with Brent and the West Texas Intermediate (WTI) moving to $112 and $100, respectively. The US and Iran have continued their ceasefire, which has led to the closure of the Strait of Hormuz.
There are signs that oil will continue rising in the near term as long as the Iran war and the ceasefire continues.
Soaring crude oil prices will lead to higher inflation, which will limit the Federal Reserve's path to cutting interest rates even when Kevin Warsh becomes the Chairman.
The Federal Reserve will deliver its interest rate decision later today, with most analysts expecting it to leave interest rates unchanged between 3.50% and 3.75%. A dovish Fed decision will be bullish for the BTC/USD pair.
Bitcoin is also falling as the Fear and Greed Index retreated, moving from the greed zone of 61 to the neutral point at 40. In most cases, Bitcoin tends to drop when the greed era is ending.
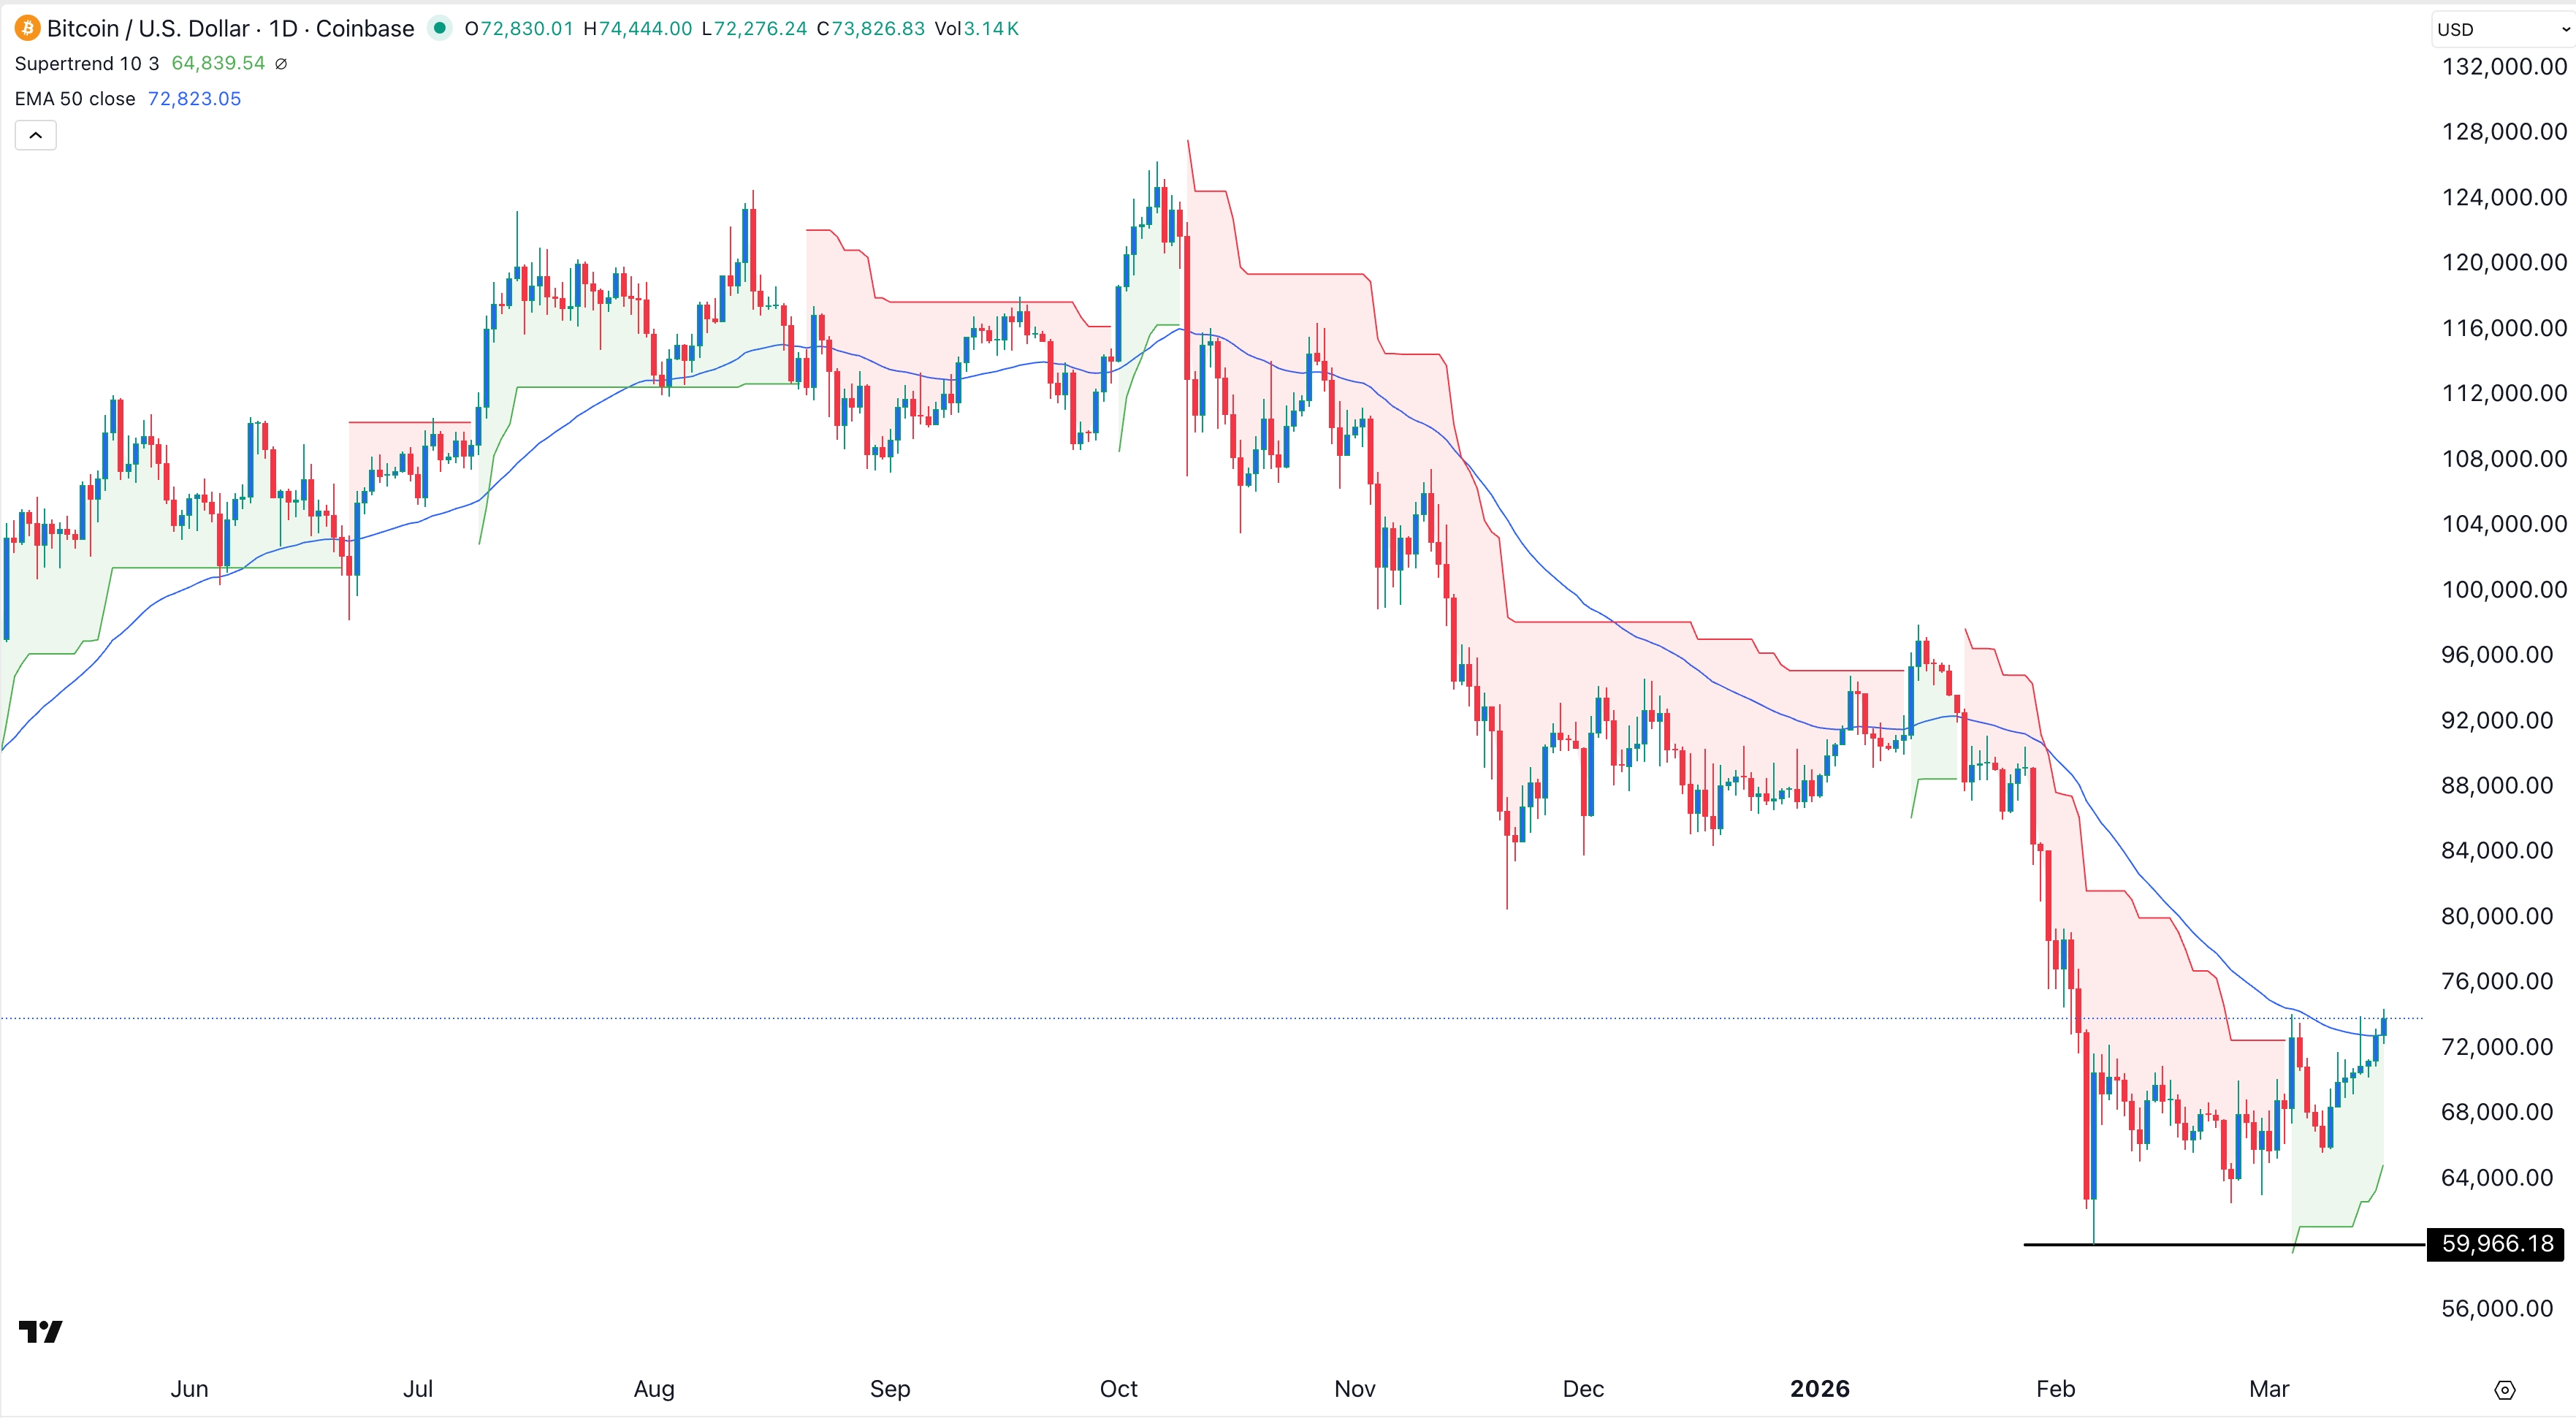
BTC/USD Technical Analysis
The daily timeframe chart shows that the BTC/USD pair pulled back to 76,000 from this month's high of 79,360, where it faced substantial rejection and formed a small double-top pattern.
Bitcoin has moved slightly below the important support level at $76,410, its highest point in March this year. Also, the Relative Strength Index (RSI) and the MACD indicators have continued falling.
On the positive side, the BTC/USD pair has moved above the 50-day Exponential Moving Average (EMA). Therefore, the pair will likely remain under pressure as long as it is below the key resistance level at 79,360. A move above that level will point to more gains, potentially to the resistance level at 80,000.
On the flip side, a drop below the 50-day moving average at 73,465 will invalidate the bullish outlook and point to more downside.