
A rare weekly MACD bullish crossover, improving RSI conditions, and a classic symmetrical triangle pattern are aligning to point toward renewed bullish momentum. Are these the catalysts SOL/USD needs to finally break resistance at $90?
Solana's MACD and RSI Signal a Powerful Move in SOL Price
One of the strongest signals currently emerging on Solana’s chart is a bullish MACD crossover on the weekly timeframe. The MACD line (blue) recently crossed above the signal line (orange) for the first time since May 2025. Historically, this setup has been highly reliable in signaling the start of substantial price rallies for SOL.
The last time the MACD sent a bullish cross was in May 2025, preceding a roughly 100% rally that took SOL price from around $125 to over $250. Earlier instances delivered even more explosive gains: an 860% surge in 2023 and a 617% advance in 2021.
This pattern reflects a shift in momentum where shorter-term moving averages begin to outperform longer-term ones, often confirming the end of a corrective phase and the beginning of a new uptrend.
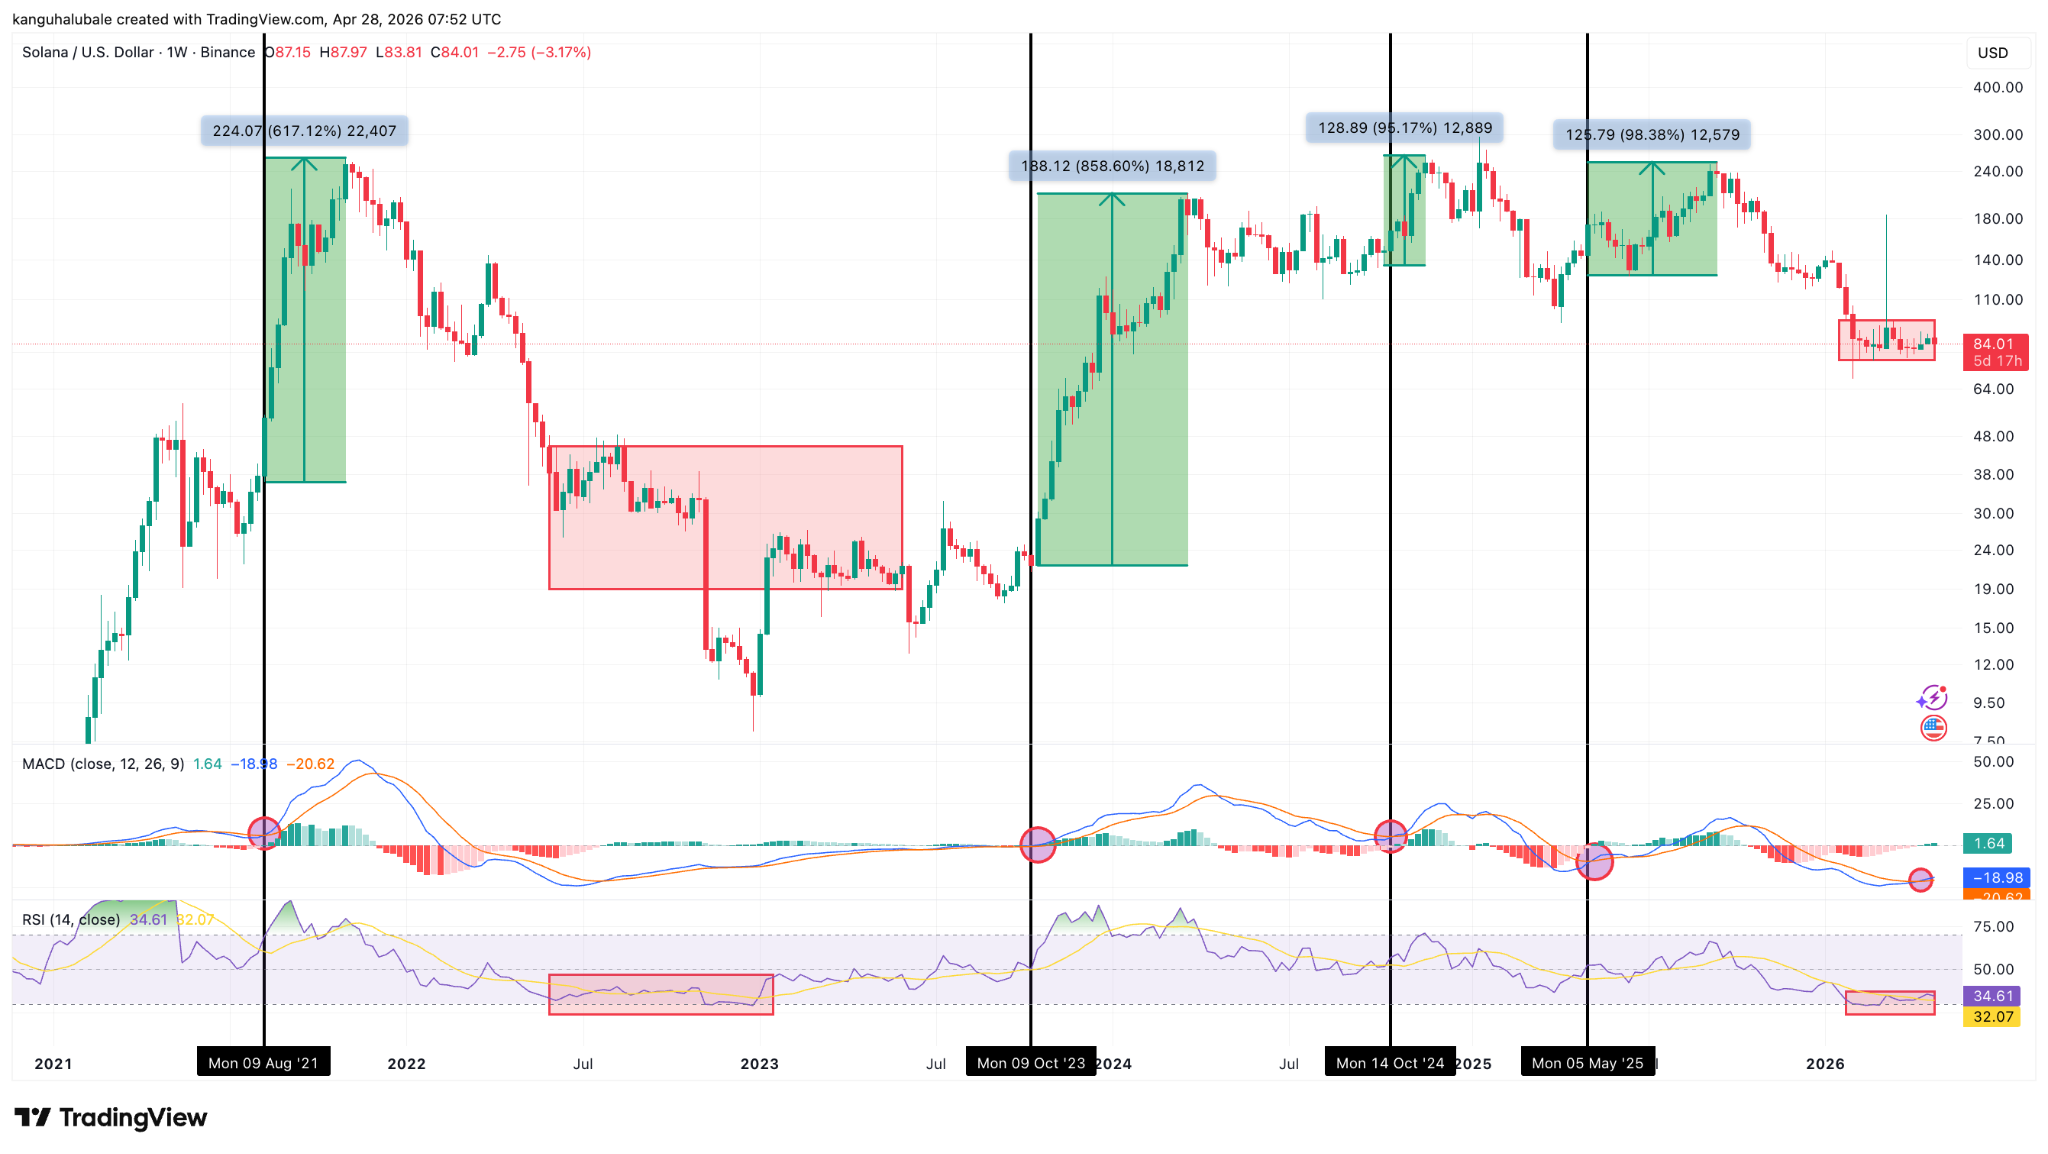
SOL/USD weekly chart. Source: TradingView
Complementing the MACD signal is the behavior of the Relative Strength Index (RSI) on the weekly chart. SOL’s weekly RSI has recovered to around 35 after hitting deeply oversold levels near 25 in mid-February.
This mirrors conditions seen at the 2022 bear market bottom, which was followed by a staggering 2,500% rally to $210 by early 2024.
Some analysts note that the RSI recently touched sub-35 levels for the first time in over 1,200 days, a rarity that has previously marked major cycle lows. However, analyst More Crypto Online said the “long-term bottom is not confirmed.”
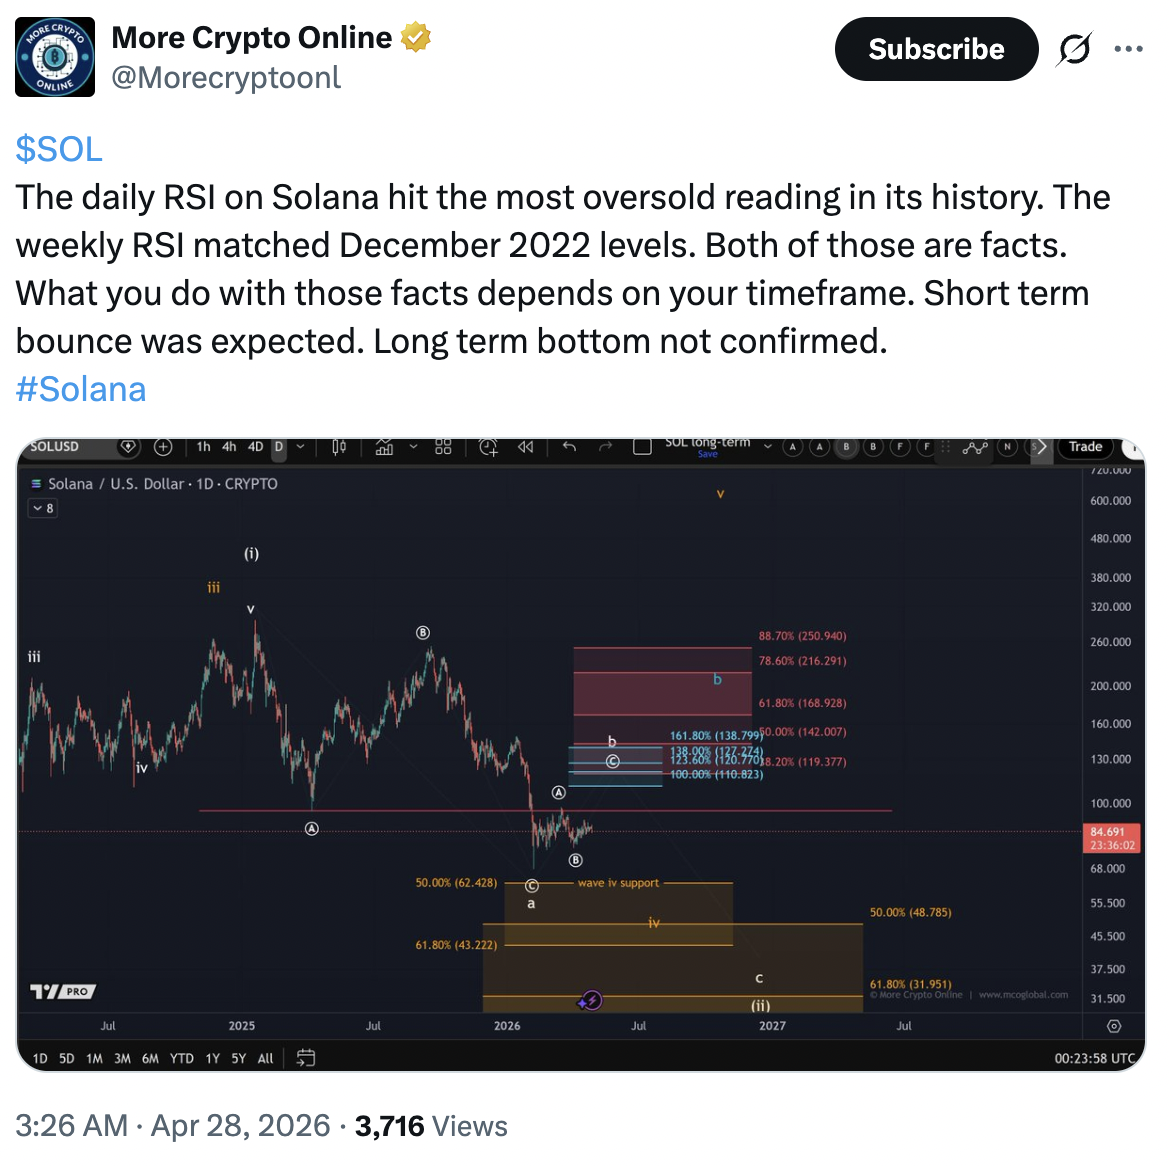
SOL/USD oversold
The combination of the MACD flip, bullish divergence, and RSI recovery are evidence that SOL is coiling for a powerful move. These momentum indicators suggest that selling pressure is exhausting and that a trend reversal could be gaining traction, provided broader market conditions remain supportive.
Solana’s Symmetrical Triangle Targets $130 SOL Price
Solana’s price action has formed a classic symmetrical triangle on the daily chart, as shown below.
This is a bullish continuation pattern characterized by converging trendlines—descending resistance and ascending support—reflecting a period of consolidation where buyers and sellers are battling for control.
The pattern will resolve once the SOL/USD pair breaks above the triangle’s resistance line at $90. If this happens, the price could rise by as much as the maximum distance between the triangle’s trend lines.
That puts SOL’s breakout target at about $130, up by about 55% from current price levels.
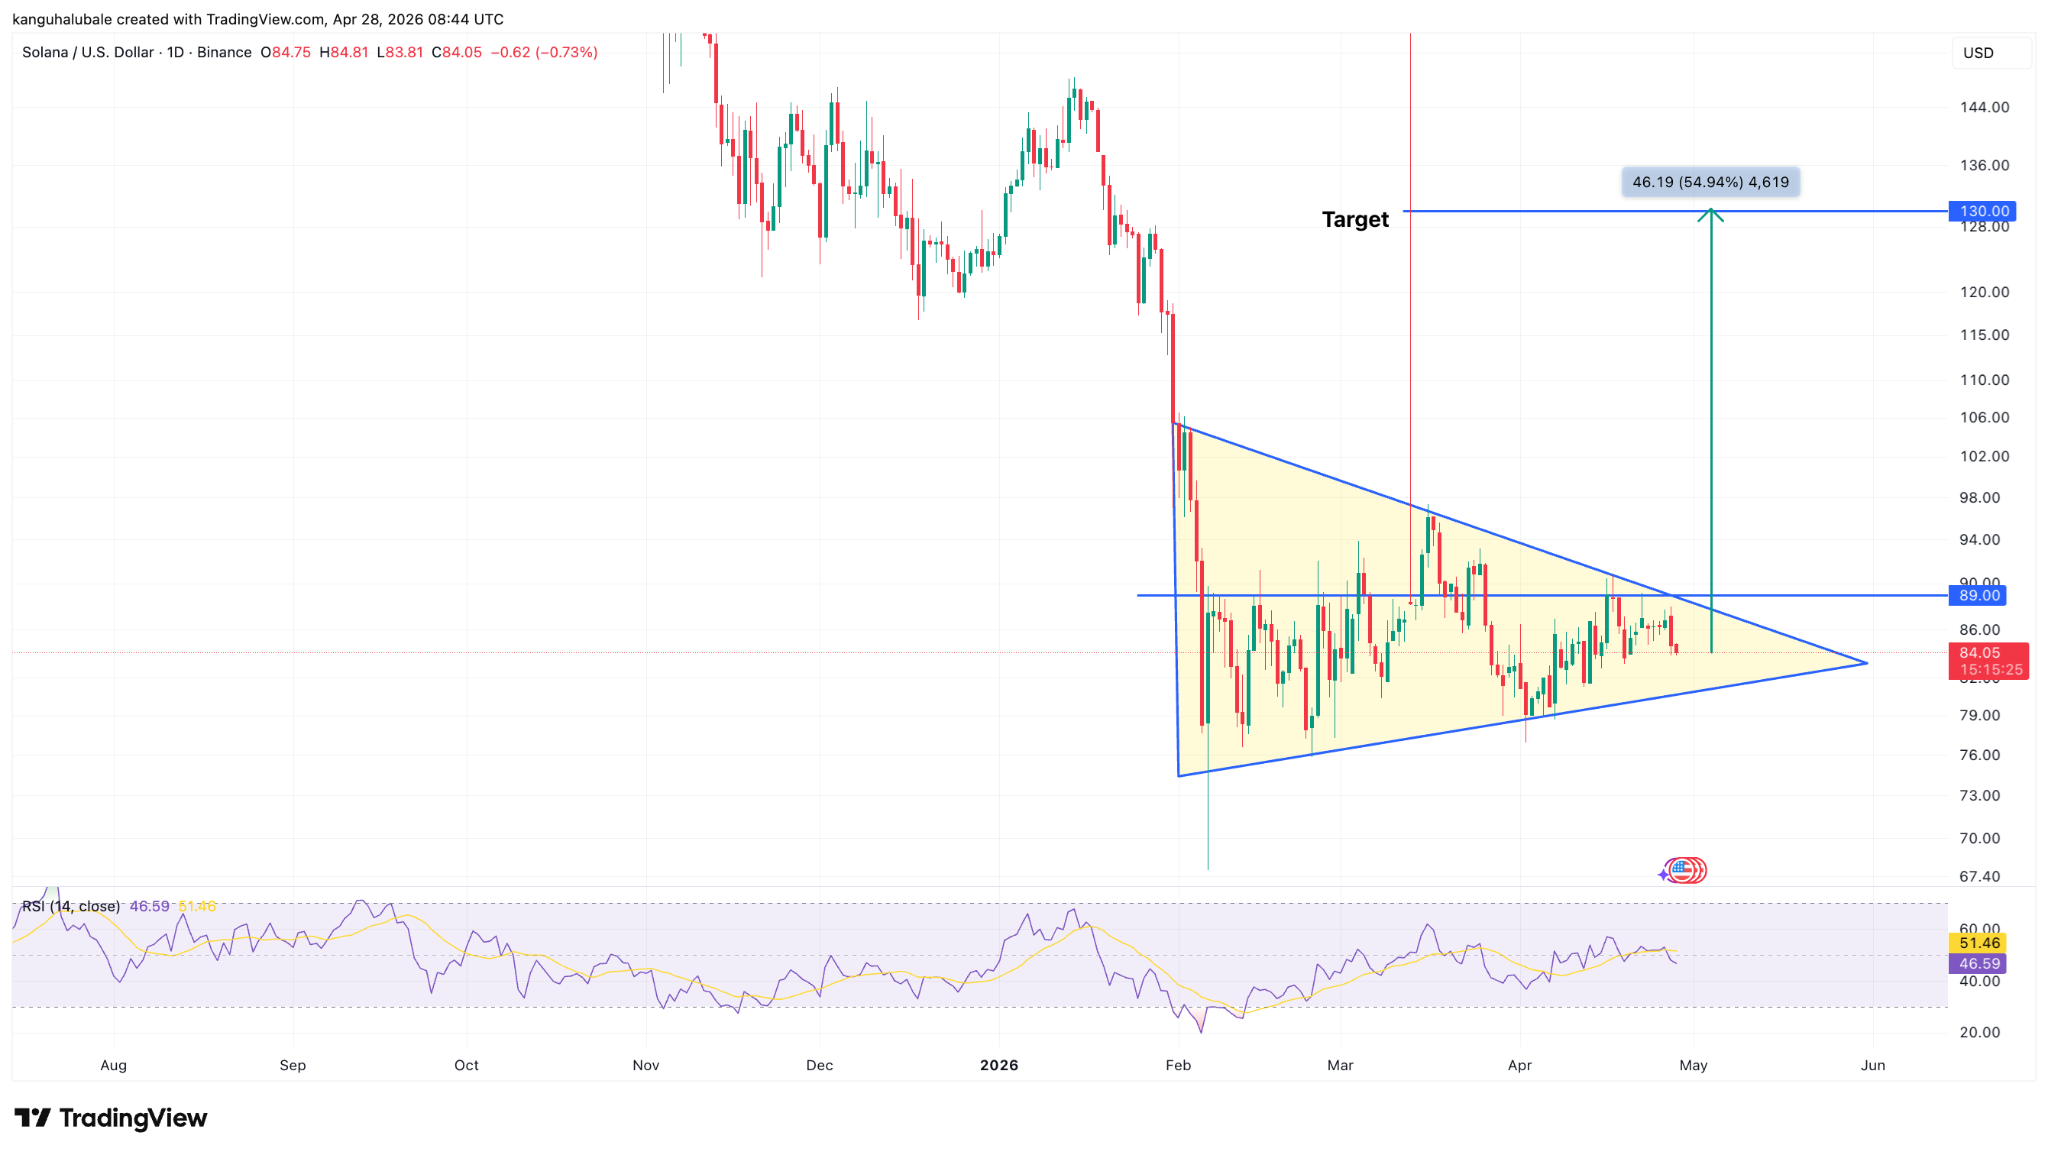
SOL/USD daily chart. Source: Cointelegraph/TradingView
The daily RSI has increased to 52, from oversold conditions at 11 on Feb. 6, suggesting increasing upward momentum.
The convergence of pattern breakout potential and improving momentum increases the probability of a strong directional move. If SOL successfully breaks and holds above $90, it could open the door for accelerated buying as short positions are squeezed and new capital flows in.
Solana Bulls Need to Flip $90 into Support
Despite the encouraging signals, the path higher is not without obstacles. The $90–$96 zone represents a critical resistance area where multiple technical factors converge. This includes the upper trendline of the symmetrical triangle, the 100-day moving average, and a significant supply overhang identified through on-chain data.
Glassnode’s cost basis distribution heatmap reveals a dense cluster of approximately 9.9 million SOL tokens acquired at an average price between $90 and $92. This creates a potential “supply wall” where holders from that range may look to sell into strength, capping upward attempts.
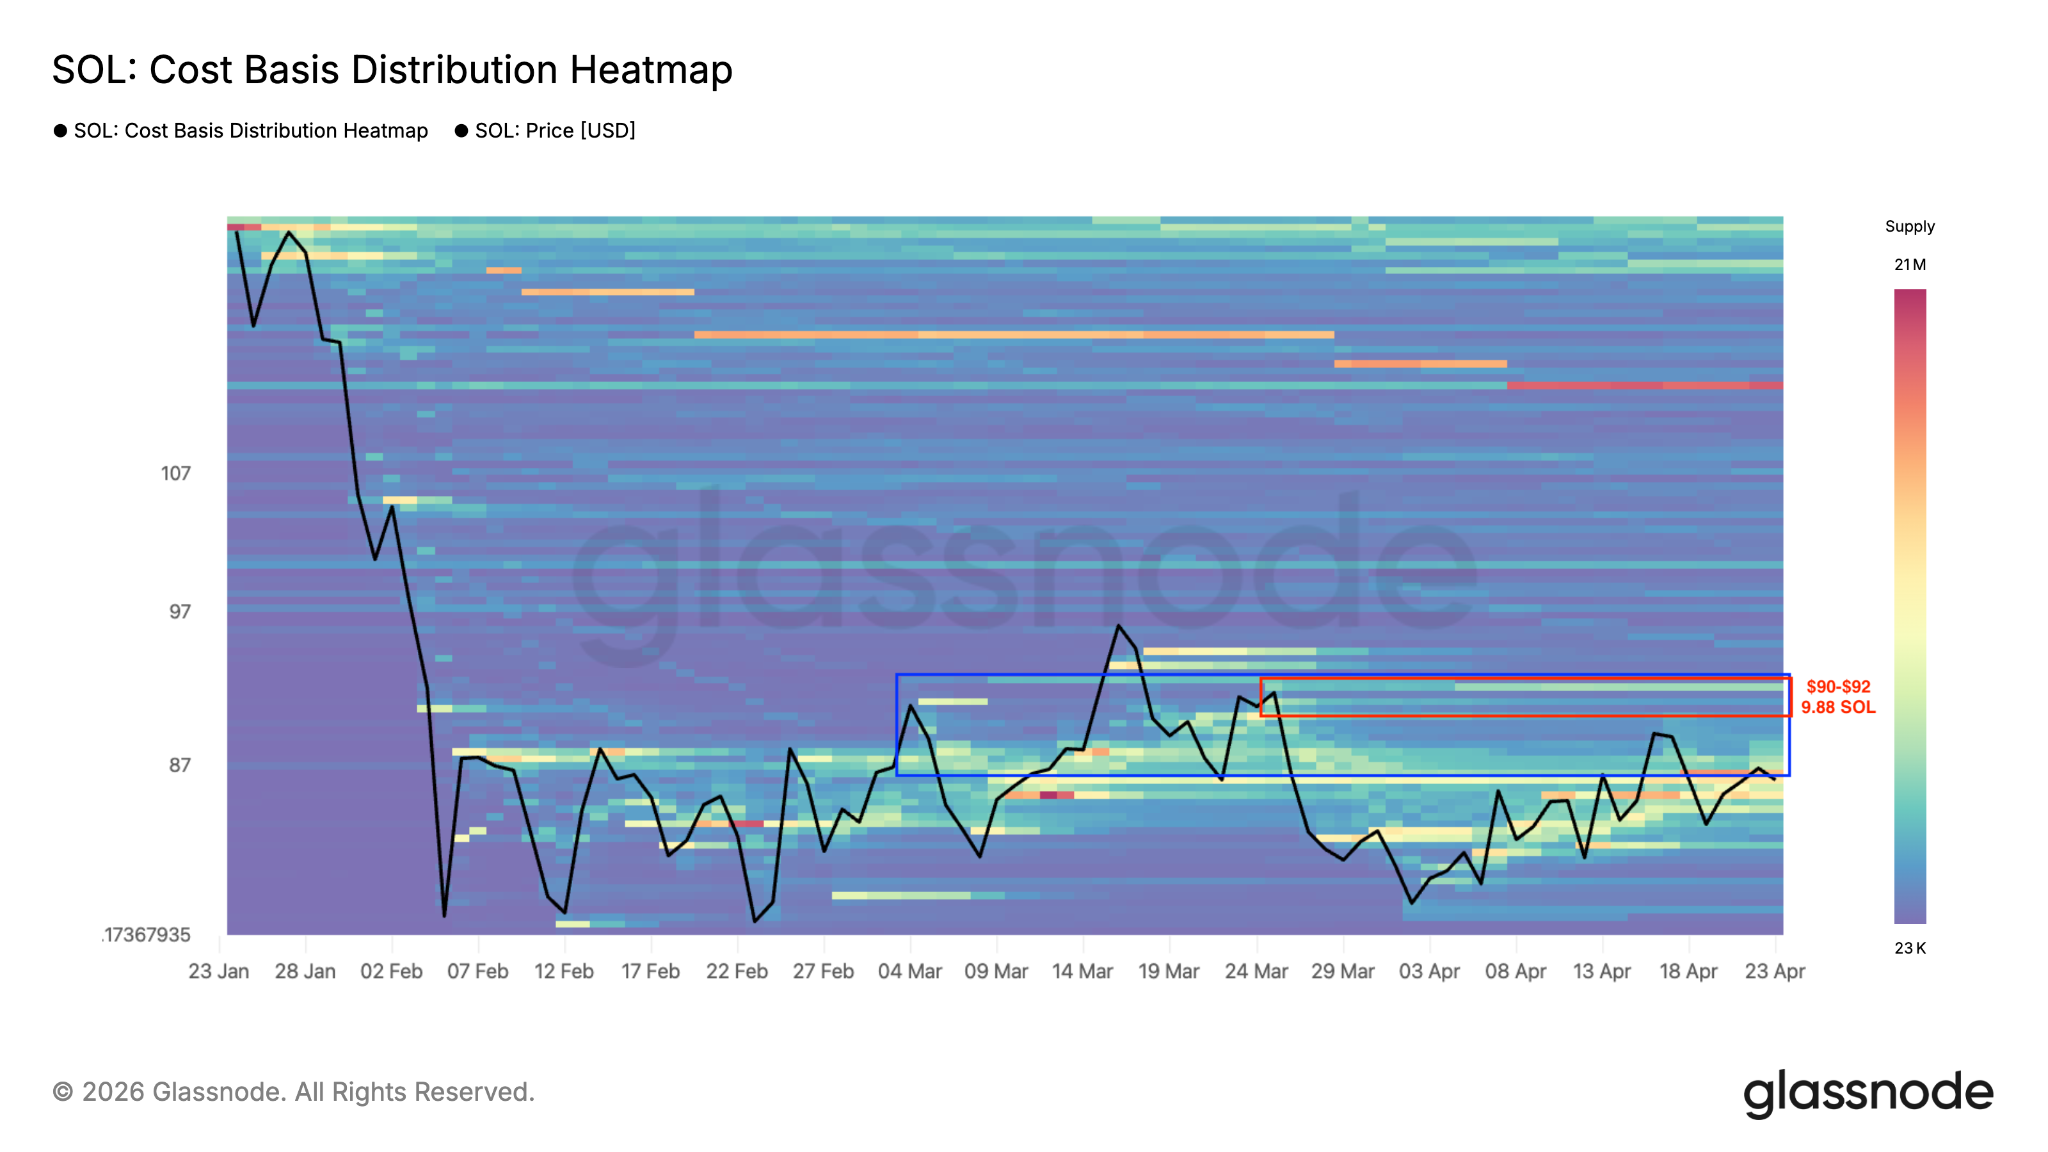
Solana cost basis distribution heatmap. Source: Glassnode
Flipping $90 into firm support will be essential for bulls to invalidate bearish scenarios and build conviction for the move toward $130 and potentially higher.
If these conditions align, SOL could transition from its current consolidation into a new leg higher, reminiscent of past explosive moves.
Traders and investors should monitor volume on any attempt above $90, as a high-volume breakout would add significant confirmation.
We hope you enjoyed reading our analysis of Solana. If you’d like to trade with one of the best crypto CFD brokers, check out our list.