
The USD/ZAR exchange rate plunged to its lowest level since March 12, continuing a downward trend that started March 31 when it peaked at 17.23. It has dropped to 16.48 as the South African rand gained momentum.
South African Rand Surges as Geopolitical Risks Ease
The USD/ZAR pair suffered a major reversal after President Donald Trump announced a ceasefire with Iran. In a Truth Social post, Trump said that the US would pause the planned strikes against Iranian infrastructure.
As a result, crude oil prices plunged, with the West Texas Intermediate and Brent falling by over 15% to $95 and $93, respectively. Such a move drop will benefit South Africa, a country that imports all of its oil.
If the ceasefire holds, it means that crude oil prices will continue falling since there are hundreds of crude oil tankers prepared to ship oil to other countries.
The USD/ZAR exchange rate plunged as the US Dollar Index (DXY) dropped to $98 from this month's high of $100.50. Looking ahead, the Federal Reserve will release minutes of the last monetary policy meeting and macro data from the US.
The US will publish key mortgage applications data, while the Federal Reserve will release minutes of the last meeting. Also, the US will release the latest US GDP and Personal Consumption Expenditure (PCE) data on Thursday. It will also release the US Consumer Price Index (CPI) data on Friday.
These numbers come a week after the US published a strong non-farm payrolls report, which showed that the economy added over 178k jobs and the unemployment rate fell to 4.3%.
USD/ZAR Technical Analysis
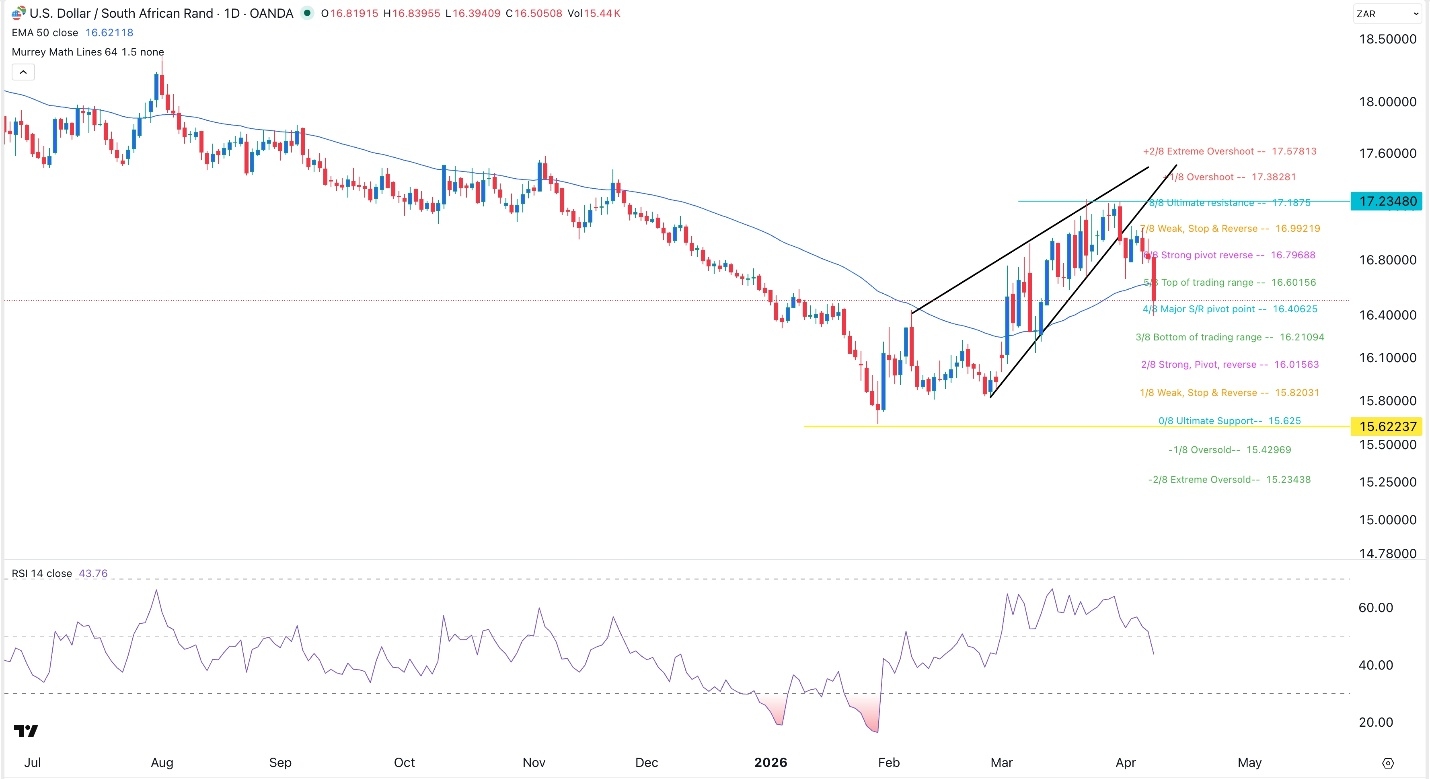
The daily chart shows that the USD/ZAR pair has slumped in the past few days, moving from a high of 17.2350 in March to the current 16.45, its lowest level since March 11. This crash happened after the pair formed a rising wedge pattern, which is made up of two ascending and converging trendlines.
The pair has slumped to the Major S&R pivot point of the Murrey Math Lines tool at 16.40. It also dropped below the 50-day Exponential Moving Average, while the Relative Strength Index (RSI) dropped below the key support level at 50.
Therefore, the pair will likely maintain its volatility in the coming days as traders watch the happenings in the Middle East. Further downside may see it drop to the Strong, Pivot, Reverse level of the Murrey Math Lines tool at 16.