


Bitcoin Edges Above $65K as Cooling US CPI Eases Fed Rate-Hike Odds
Top Regulated Brokers
Bitcoin edged above $65,000 during the early Asian trading hours on Wednesday, its strongest print since mid-June, after June's US inflation saw a surprise sudden downturn. The BTC/USD pair gained more than 5.5% ($3,400) on the day, rising as high as $65,200 before easing to its current level around $64,500.
The move came as traders repriced Fed rate-hike odds ahead of the July 29 FOMC meeting, while strengthening long-term holder conviction, and an increasingly constructive technical structure contributed to renewed optimism.
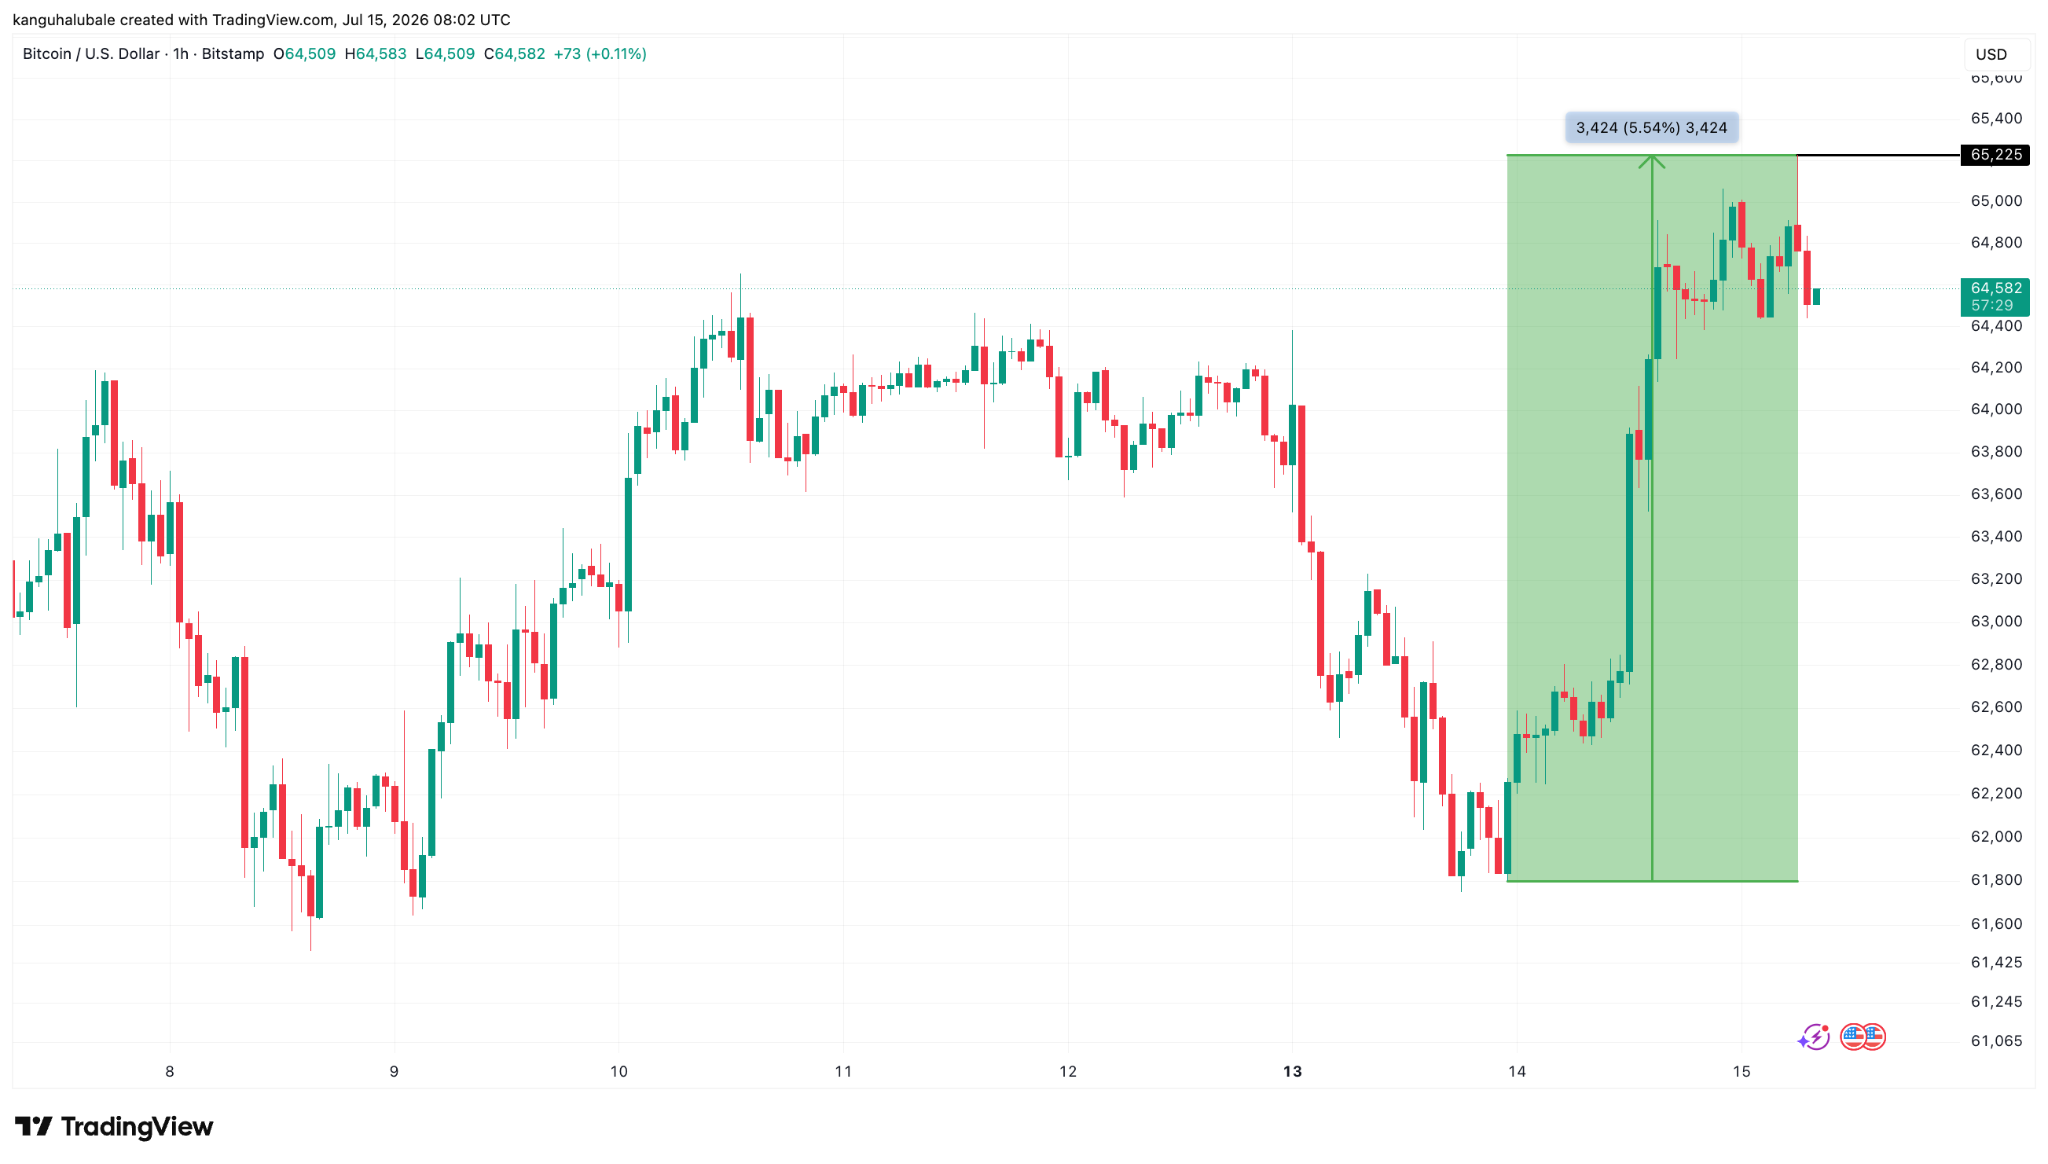
BTC/USD 1-hour chart. Source: TradingView
How the Lowest US CPI Since 2020 Helped Push Bitcoin Above $65,000
The US Consumer Price Index (CPI) print for June 2026 came in below economists' expectations, falling 0.4% month-over-month, according to data from the US Bureau of Labor Statistics (BLS). The softer inflation reading marked the lowest annual CPI increase since early 2020, reinforcing the view that price pressures across the US economy continue to ease.
The annual rate slowed to 3.5% from May's 4.2%, undershooting the 3.8% forecast, while core CPI, the Fed's preferred gauge, was flat for the month, pulling the annual core rate to 2.6%, its lowest since February.
Energy led the drop despite headwinds from the US-Iran war and the closure of the Strait of Hormuz oil route.
“The index for energy fell 5.7 percent in June after rising 3.9 percent in May, 3.8 percent in April, and 10.9 percent in March,” the BLS said, adding:
“The energy index was the largest contributor to the monthly all items decrease, more than offsetting increases in other indexes, including those for shelter and food.”
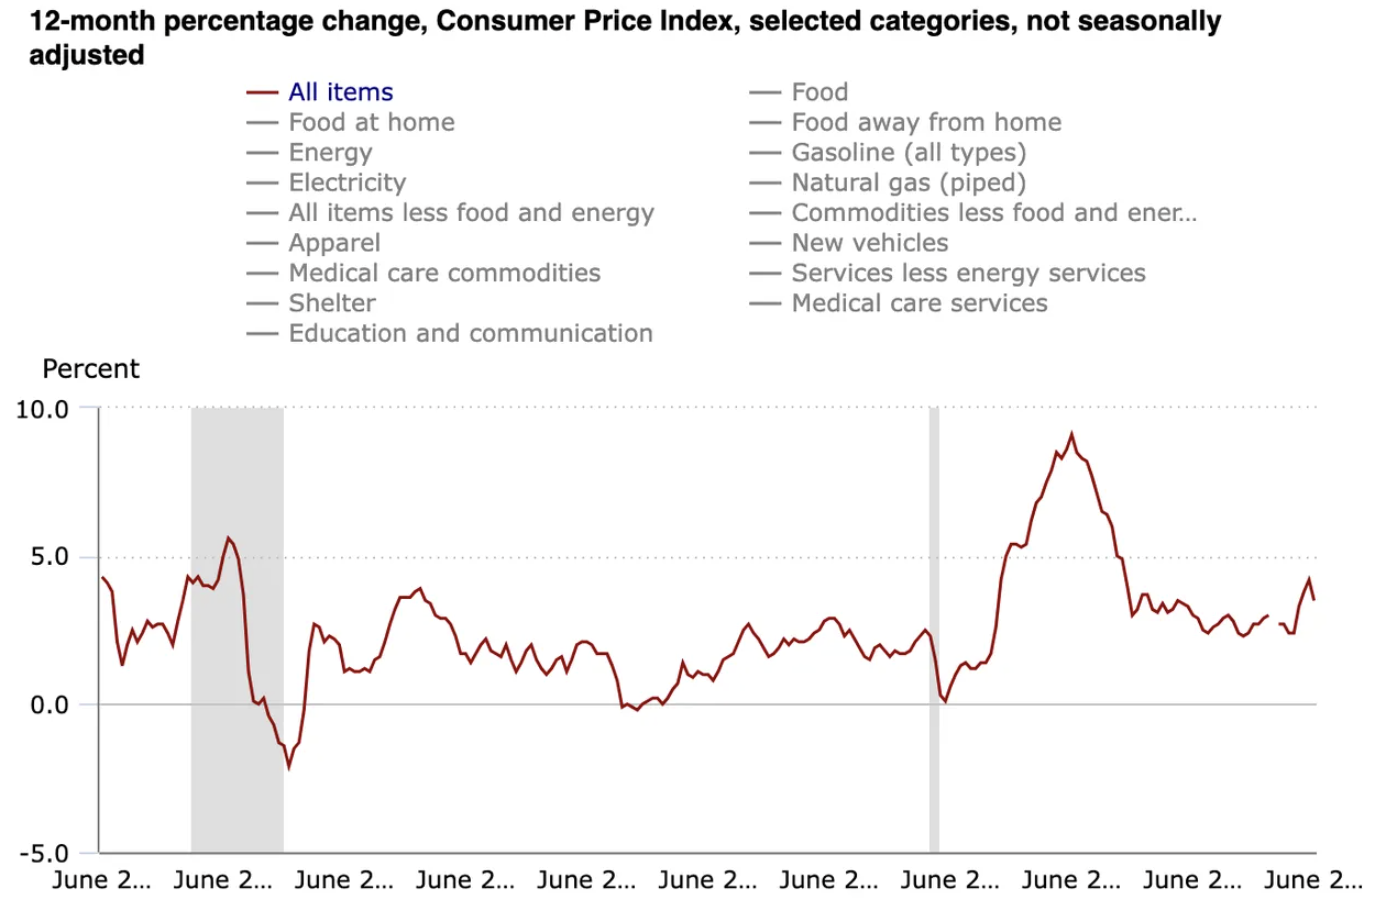
US CPI 12-month % change. Source: US Bureau of Labor Statistics
Bitcoin responded immediately, gaining more than 3.22 % over the last 24 hours to trade at $64,600. Ether was a standout at nearly $1,873, up 5.3% on the day and 7.1% over seven sessions. Hyperliquid's HYPE gained 5.2% to $67, XRP added 3.4% to $1.10, Solana (SOL) rose 3% to $77, Dogecoin (DOGE) climbed 2.9% and BNB added 1% to $576.
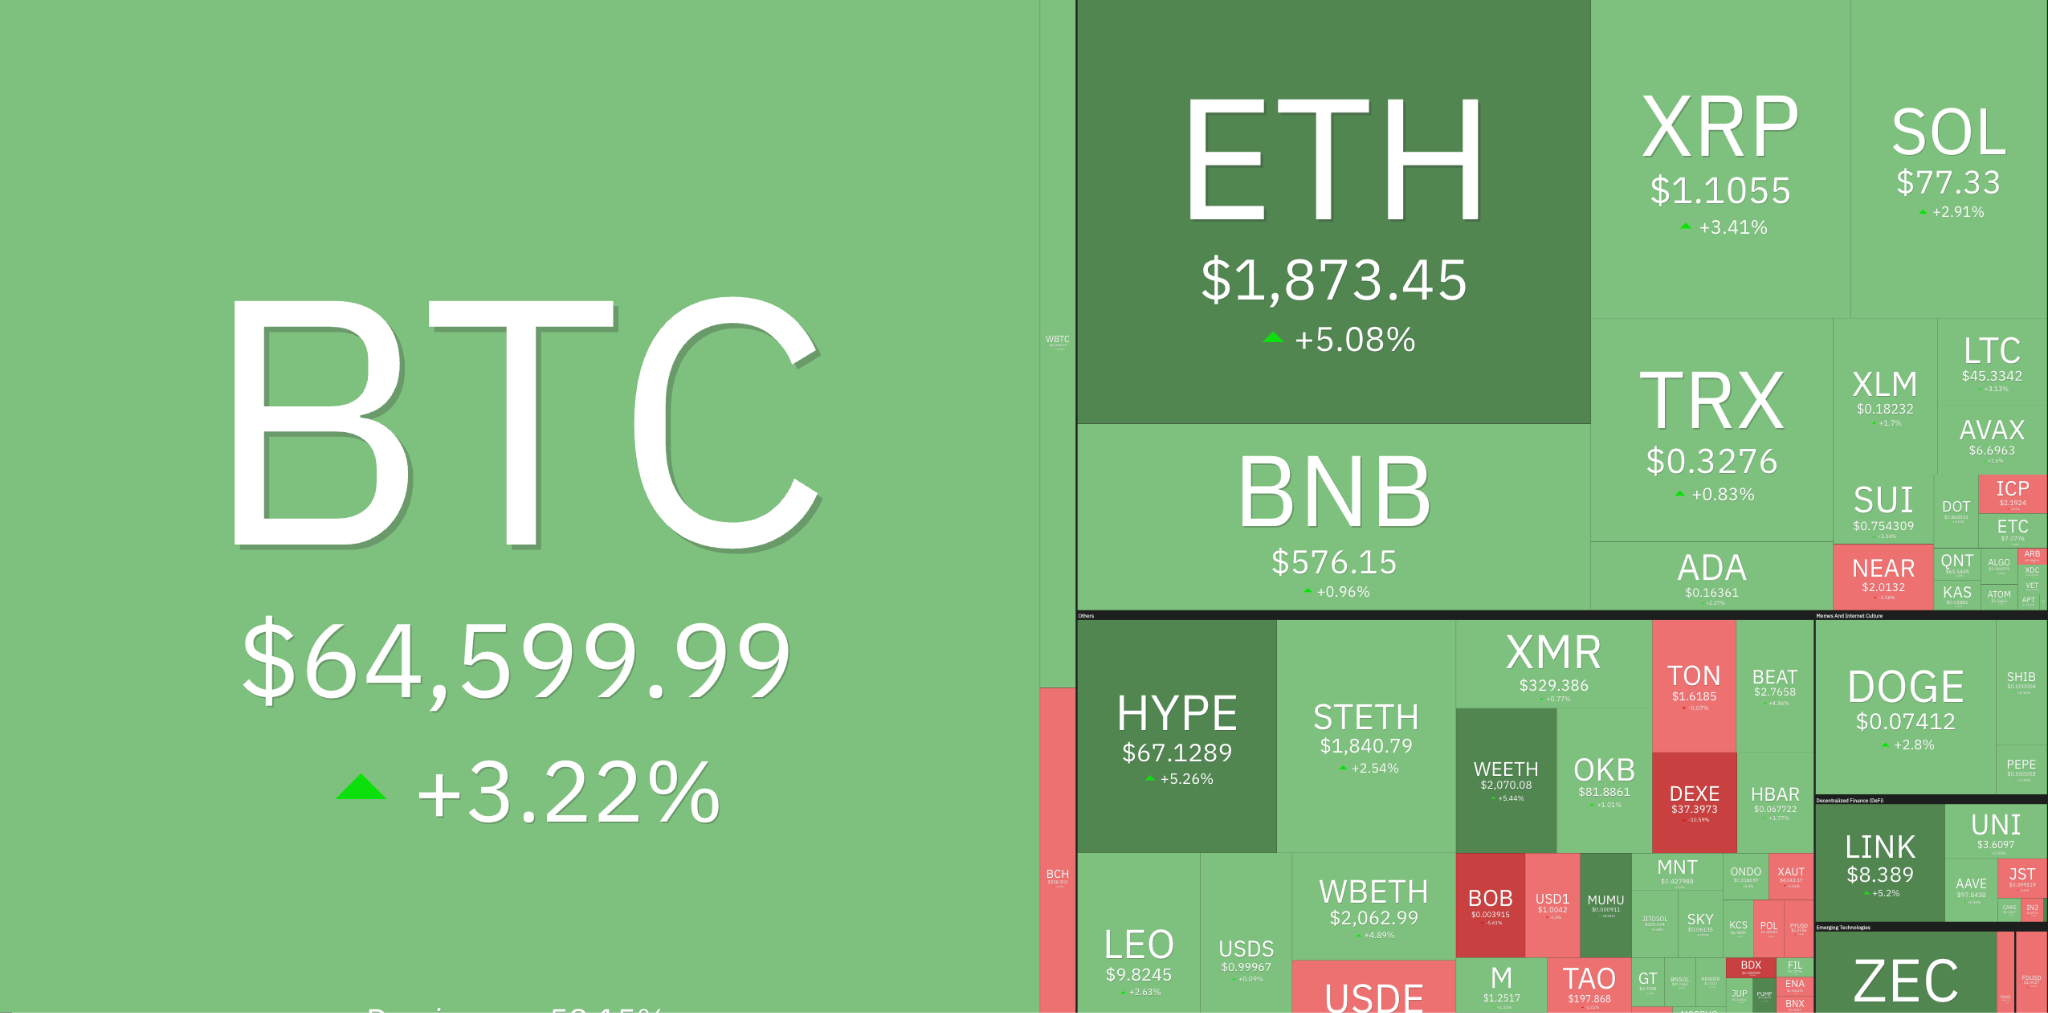
24-hour performance of top-cap cryptocurrencies. Source: Coin360
The inflation report also lowered Treasury yields immediately while weakening the US dollar, creating a supportive backdrop for risk assets, including cryptocurrencies.
Lower inflation also reduces pressure on the Federal Reserve to maintain restrictive monetary policy, prompting traders to further scale back expectations of another interest-rate increase at the July 29 Federal Open Market Committee (FOMC) meeting.
What Cooling Inflation Means for Bitcoin’s Macro Backdrop
The latest data from CME Group’s FedWatch Tool nonetheless maintained consensus for a 0.25% hike at the Fed’s September meeting, with the odds of a 0.25% rate increase in July decreasing to 14% from 31% last month.
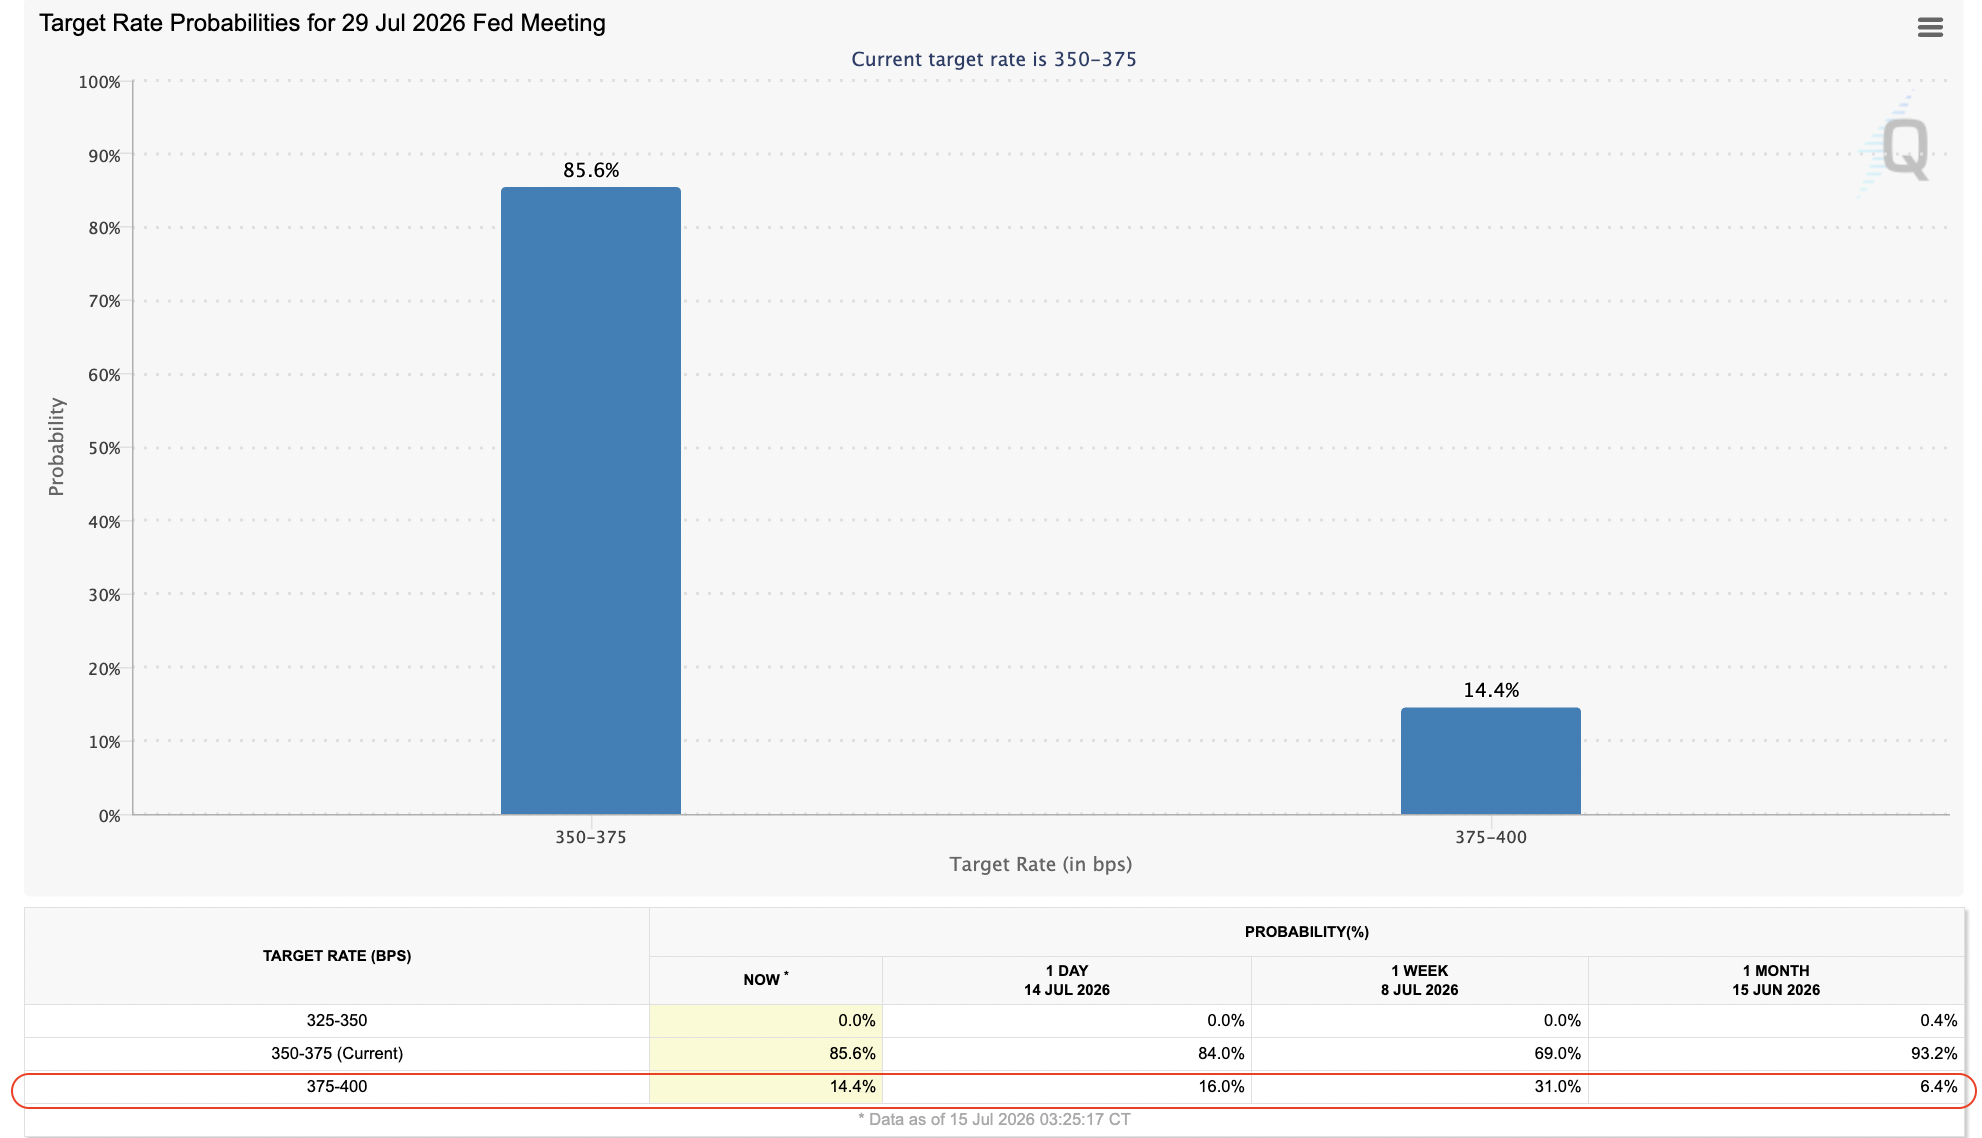
Target rate possibilities for July 29 FOMC meeting. Source: Source: CME Group
Polymarket bettors place the odds of a July hike at 7%, down from 34% a week earlier, while the odds of any 2026 hike dropped to 53% from 71%. The relief may be fragile, though.
Historically, Bitcoin has benefited during periods when investors anticipate easier financial conditions. Lower borrowing costs improve market liquidity while increasing demand for higher-risk assets such as equities and digital assets.
Although Federal Reserve officials have repeatedly emphasized that policy decisions remain data dependent, cooling inflation strengthens the case for keeping rates unchanged later this month. Market participants will now closely monitor upcoming employment and inflation data for confirmation that the disinflation trend remains intact.
Why Traders See the $64,000–$65,000 Zone as Critical for Bitcoin’s Trend
From a technical perspective, the $64,000–$65,000 supply zone separates a relief bounce from a genuine trend change. This is where the 50-day simple moving average (yellow wave) and the 50-day exponential moving average (orange wave) converge.
The chart below shows that this resistance zone has capped every recovery attempt since early June.
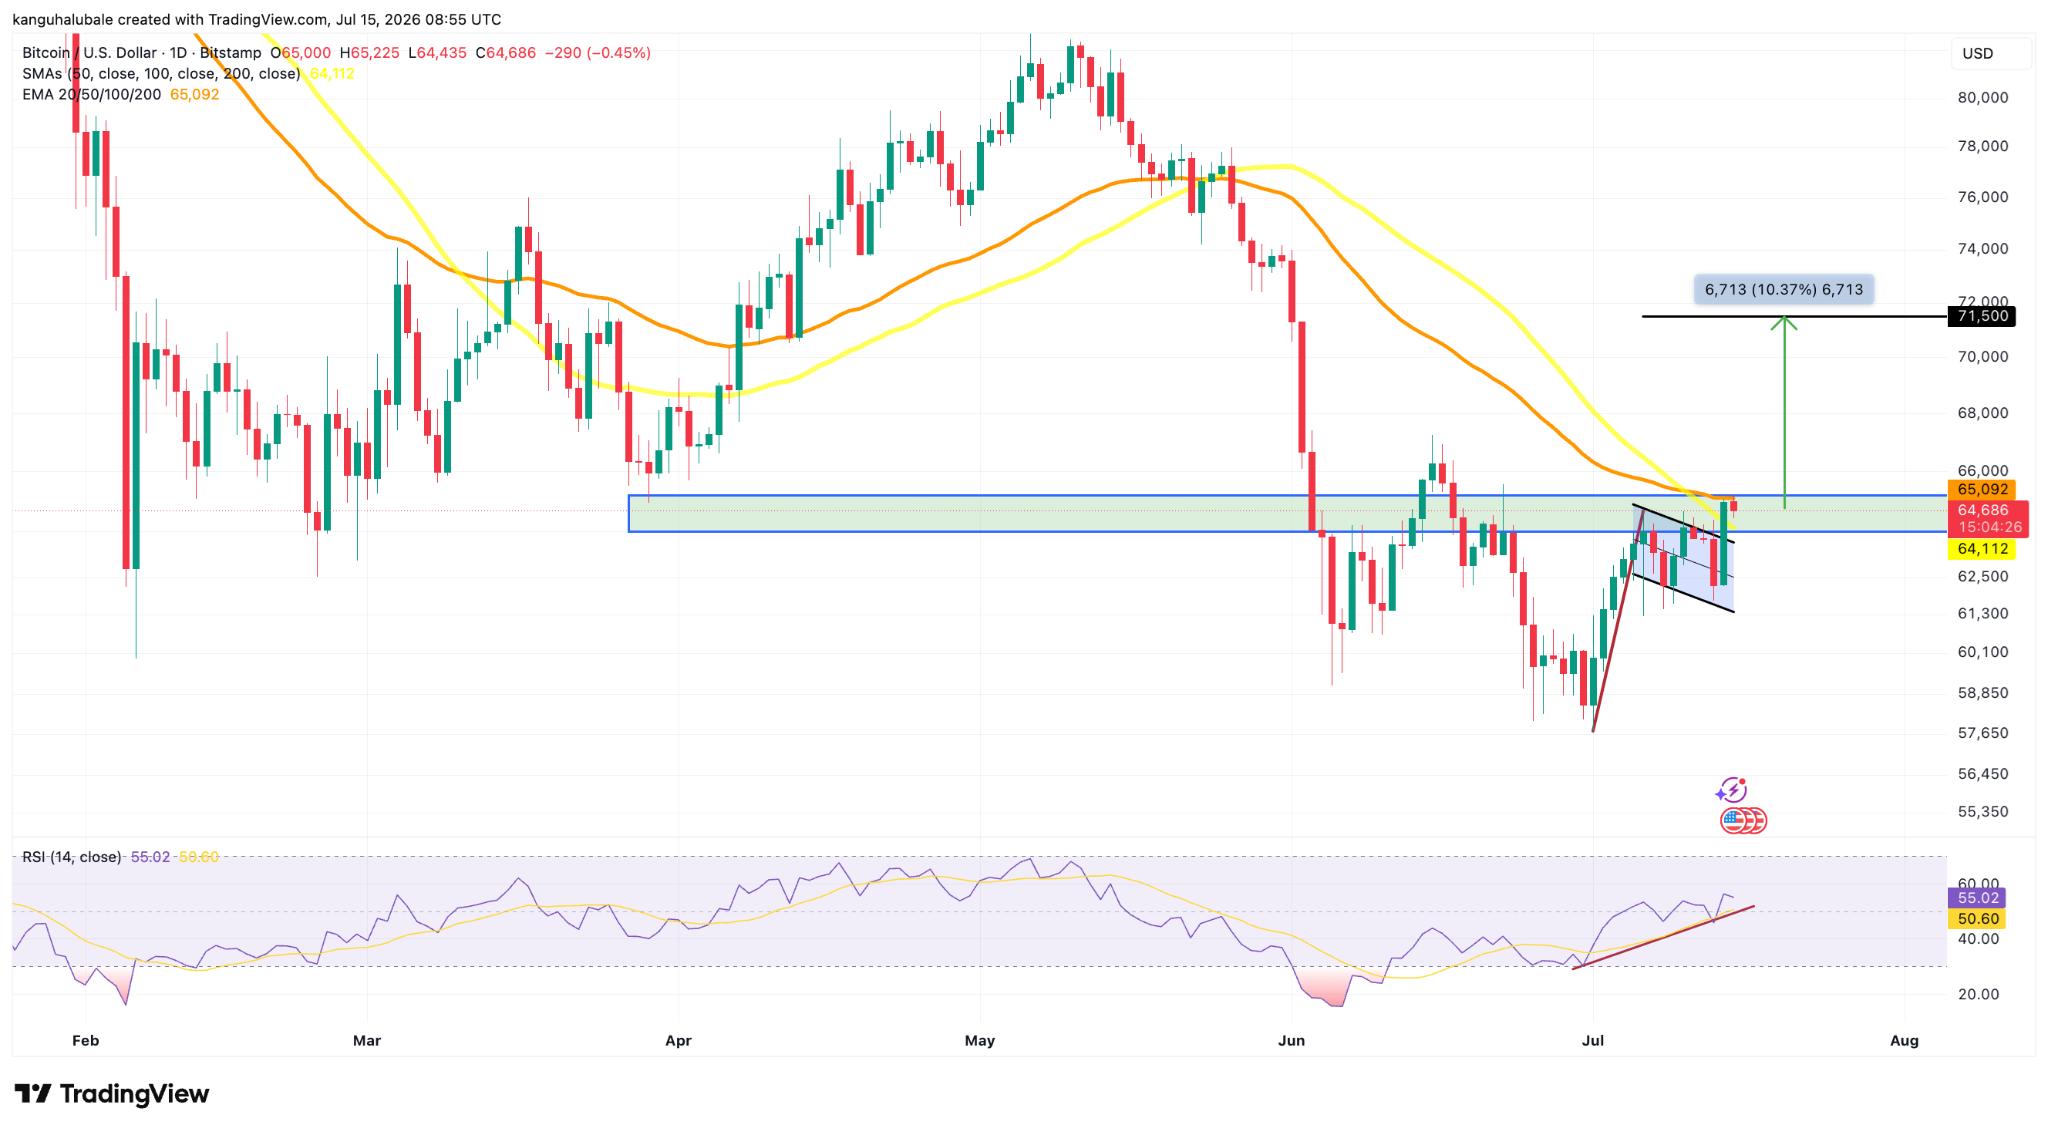
BTC/USD daily chart. Source: TradingView
Overcoming this zone would open the way for a rally toward the upside target of the bull flag at $71,500, about 10% above the current price.
Analyst Michaël van de Poppe flagged a bullish divergence from the relative strength index (RSI), that could continue propelling the BTC price higher.
“Break $65,000 and it's above the 21-Day MA and breaks back in the range,” the MN Capital founder said in a Monday post on X, adding:
“The deviation beneath the range low is over and we're going to be targeting the range high going forward.”
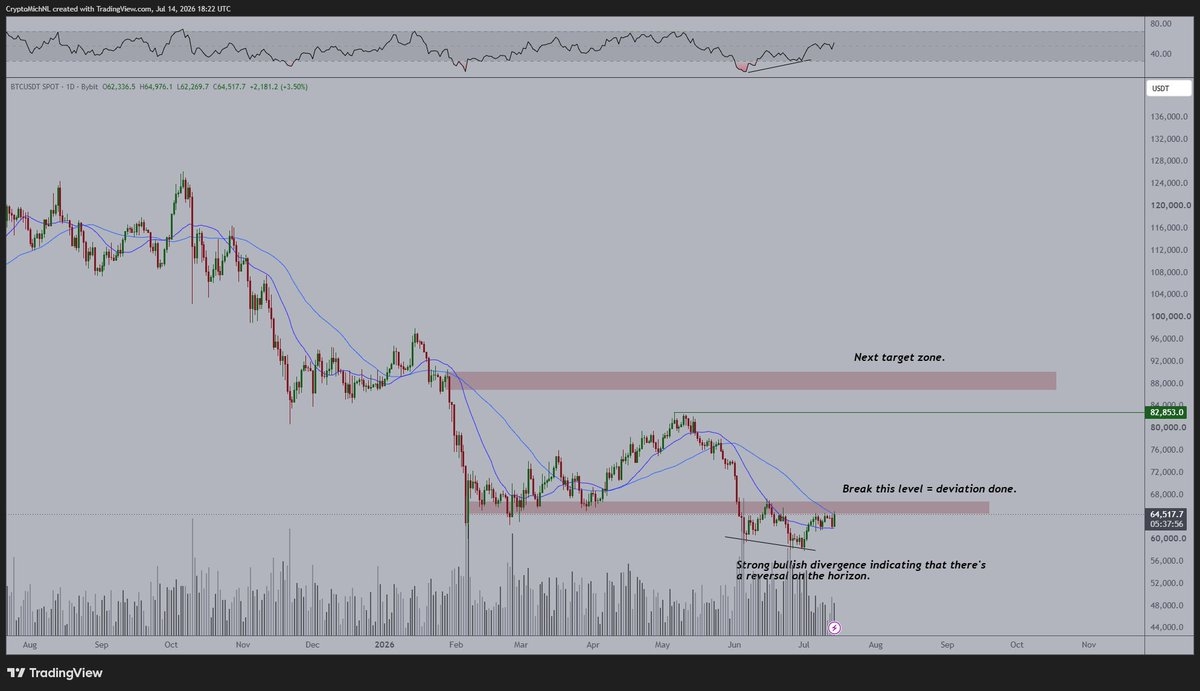
BTC/USD daily chart. Source: X/Michael van de Poppe
Van de Poppe referred to the $83,000 range-high reached on May 6.
On the downside, the 20-day EMA near $63,000 is the first line of defense, with firmer support at $60,000, where investors acquired about 97,000 BTC over the last six months.
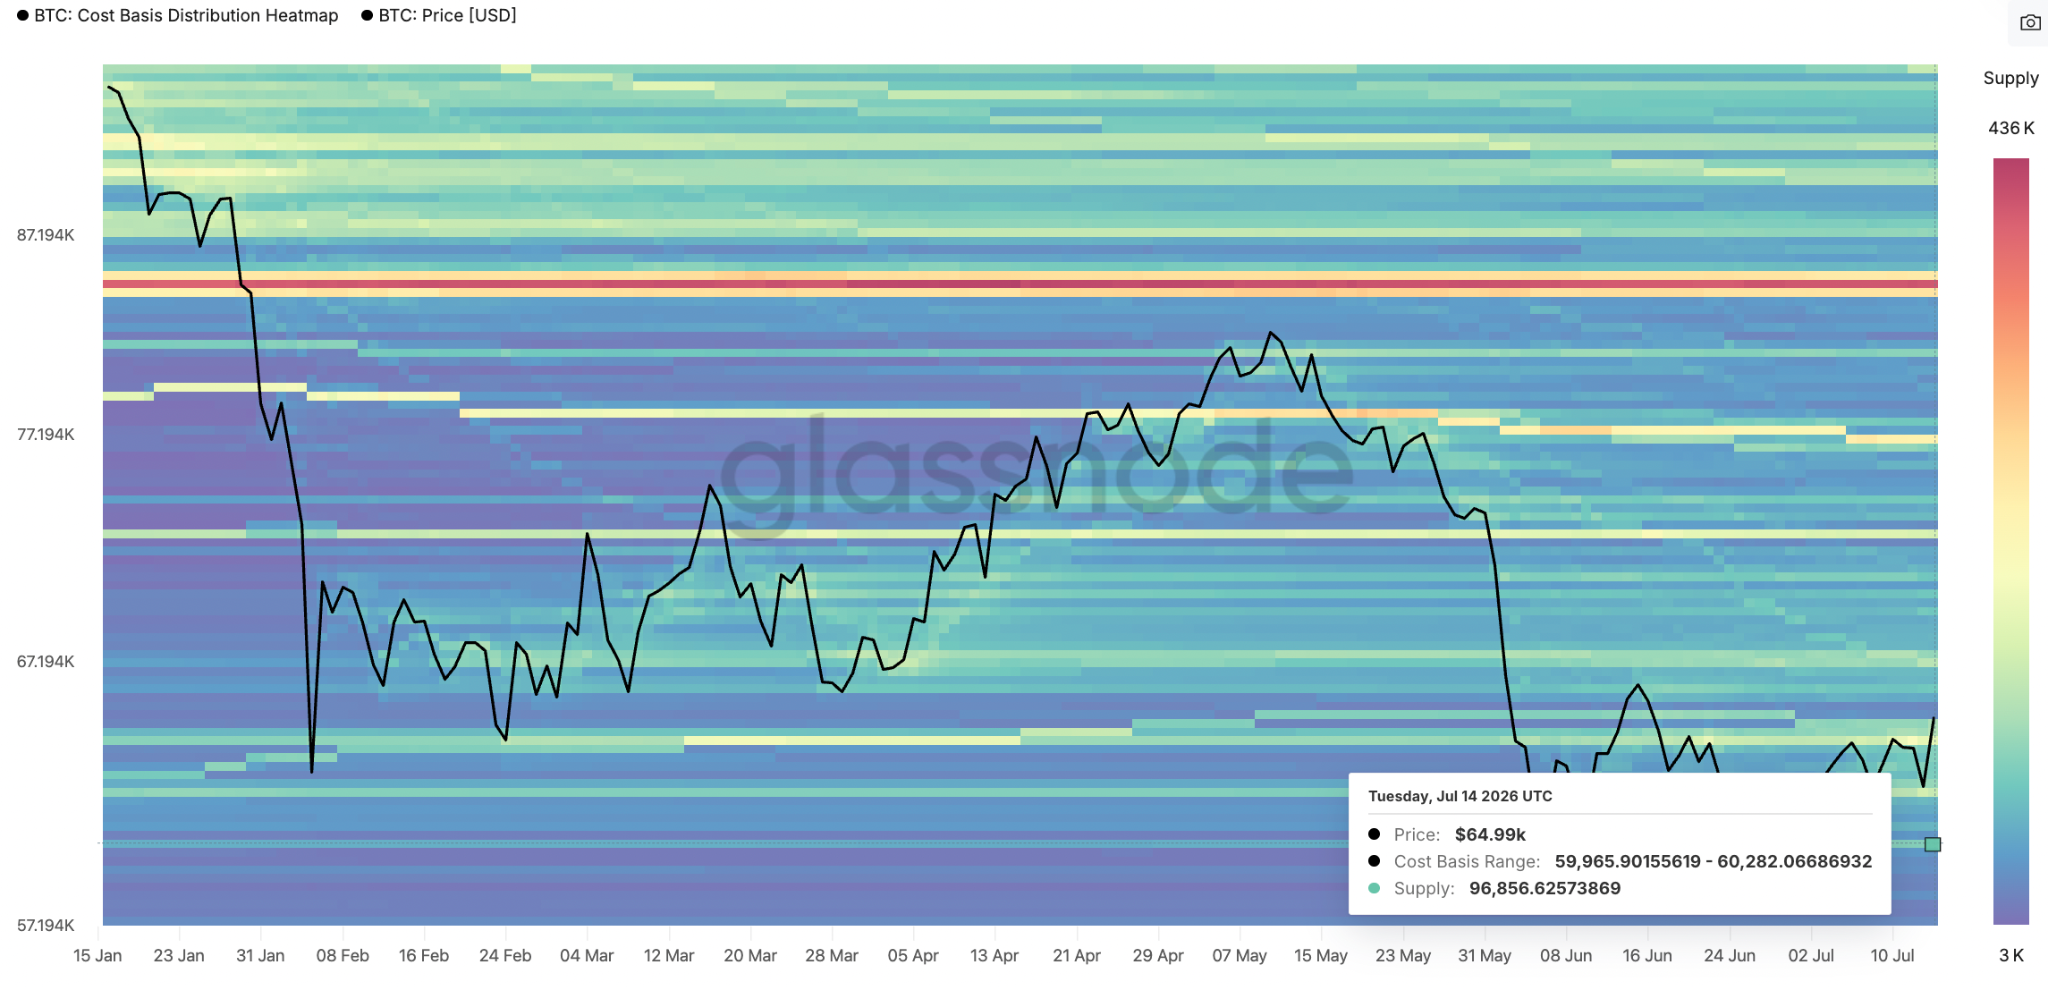
Bitcoin cost basis distribution heatmap. Source: Glassnode
How Today’s Setup Frames Bitcoin’s Risk and Reward for Holders
At this stage, Bitcoin’s reaction to cooling US inflation and the move above $65,000 look less like a final verdict and more like the start of a new test. The market now has clearer reference points: a supply zone around $64,000–$65,000 that needs to be reclaimed convincingly for a sustained advance, and layered support down toward $60,000 that will carry heavier implications if it breaks. For traders and long-term holders alike, the message is to treat this relief as an opportunity to watch how price behaves around these levels, rather than assuming one data release alone has permanently resolved the tension between macro headwinds and Bitcoin’s bullish narrative.
Ready to trade our analysis of Bitcoin? Here’s our list of the best MT4 crypto brokers worth reviewing.