


Bitcoin’s Short‑Term Odds of Retaking the $70,000 Level
The majority of traders on Polymarket and Kalshi don’t expect Bitcoin to return to $70,000 over the next two days.
As of July 29, Polymarket bettors are pricing in about 1.1% odds of BTC crossing $70,000 before July 31. Kashi sets 2% odds of BTC bouncing to the $70,000 psychological level before the end of the week.
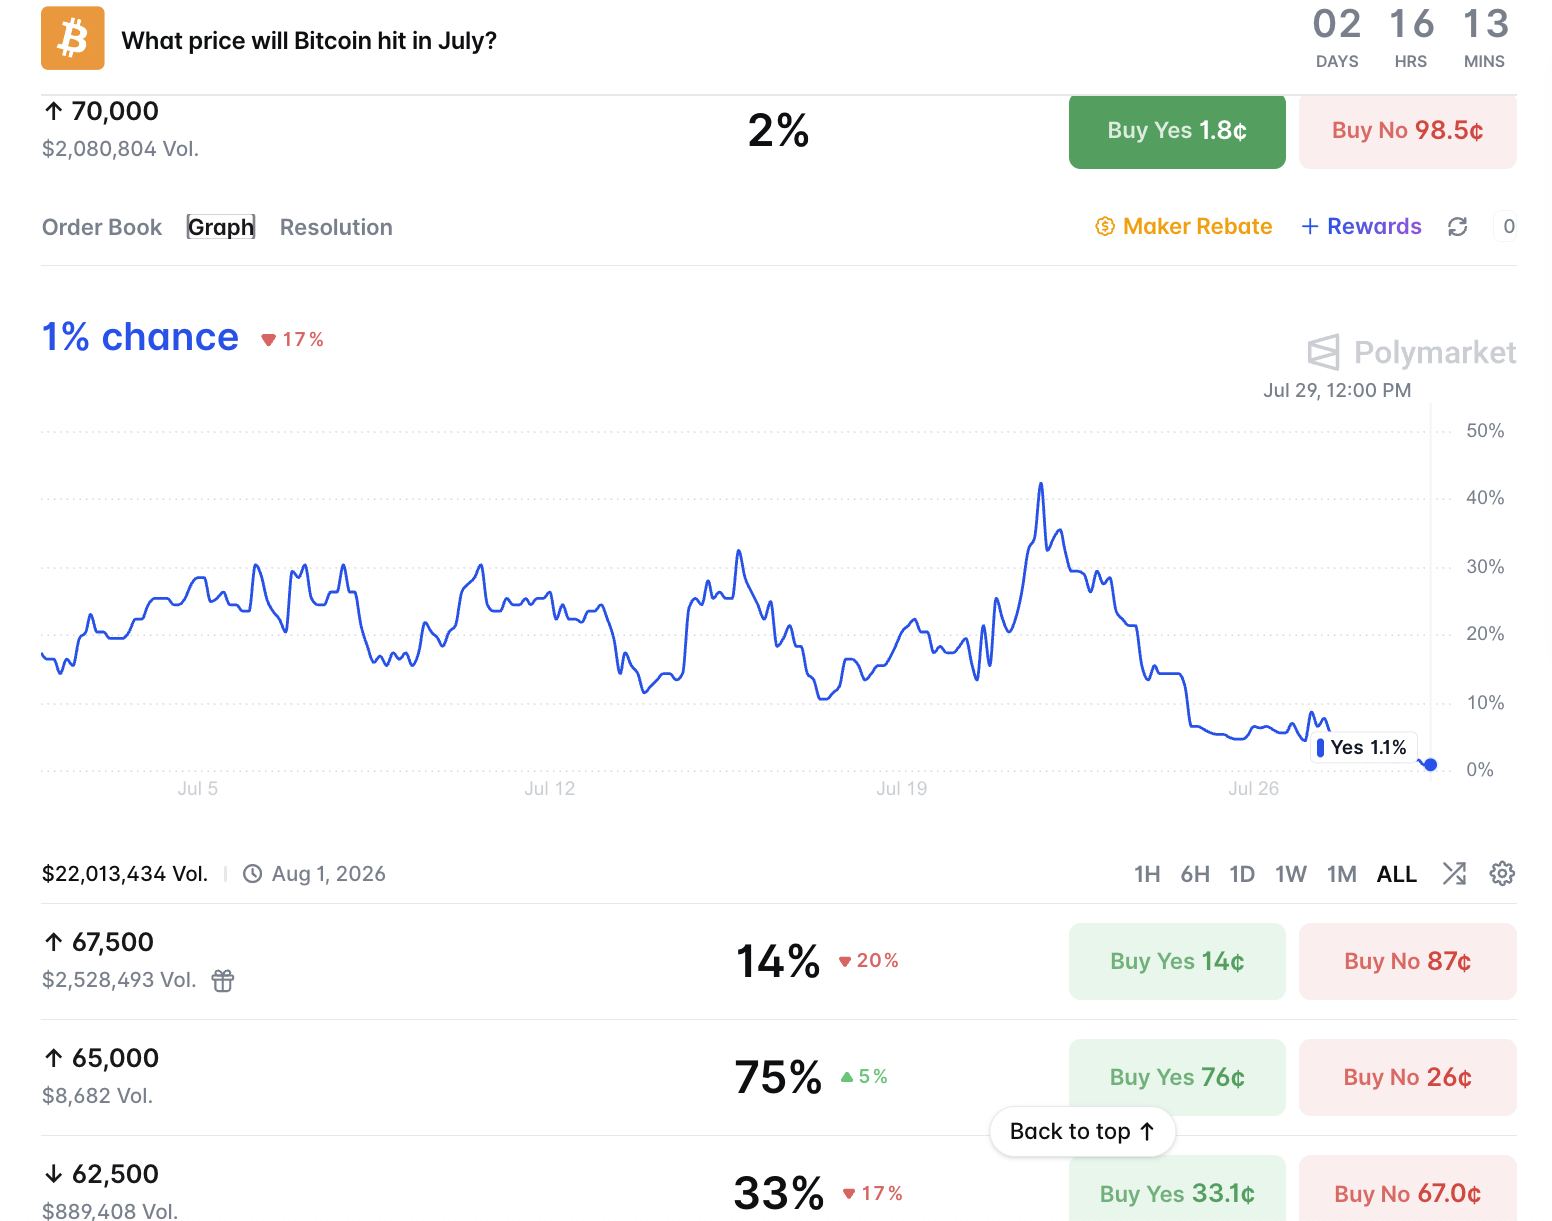
Bitcoin $100K price target before Jan. 31. Source: Polymarket
Bitcoin’s high for 2026 sits at $97,900, reached on Jan. 14, and the last time the BTC/USD pair traded above $70,000 was on June 2.
Note that the last time the BTC/USD pair dropped below $70,000 in 2024, it reclaimed the level after 238 days following a 32% drawdown.
If a similar scenario occurs, traders could retake $70,000 at the end of January 2026, as shown in the chart below.
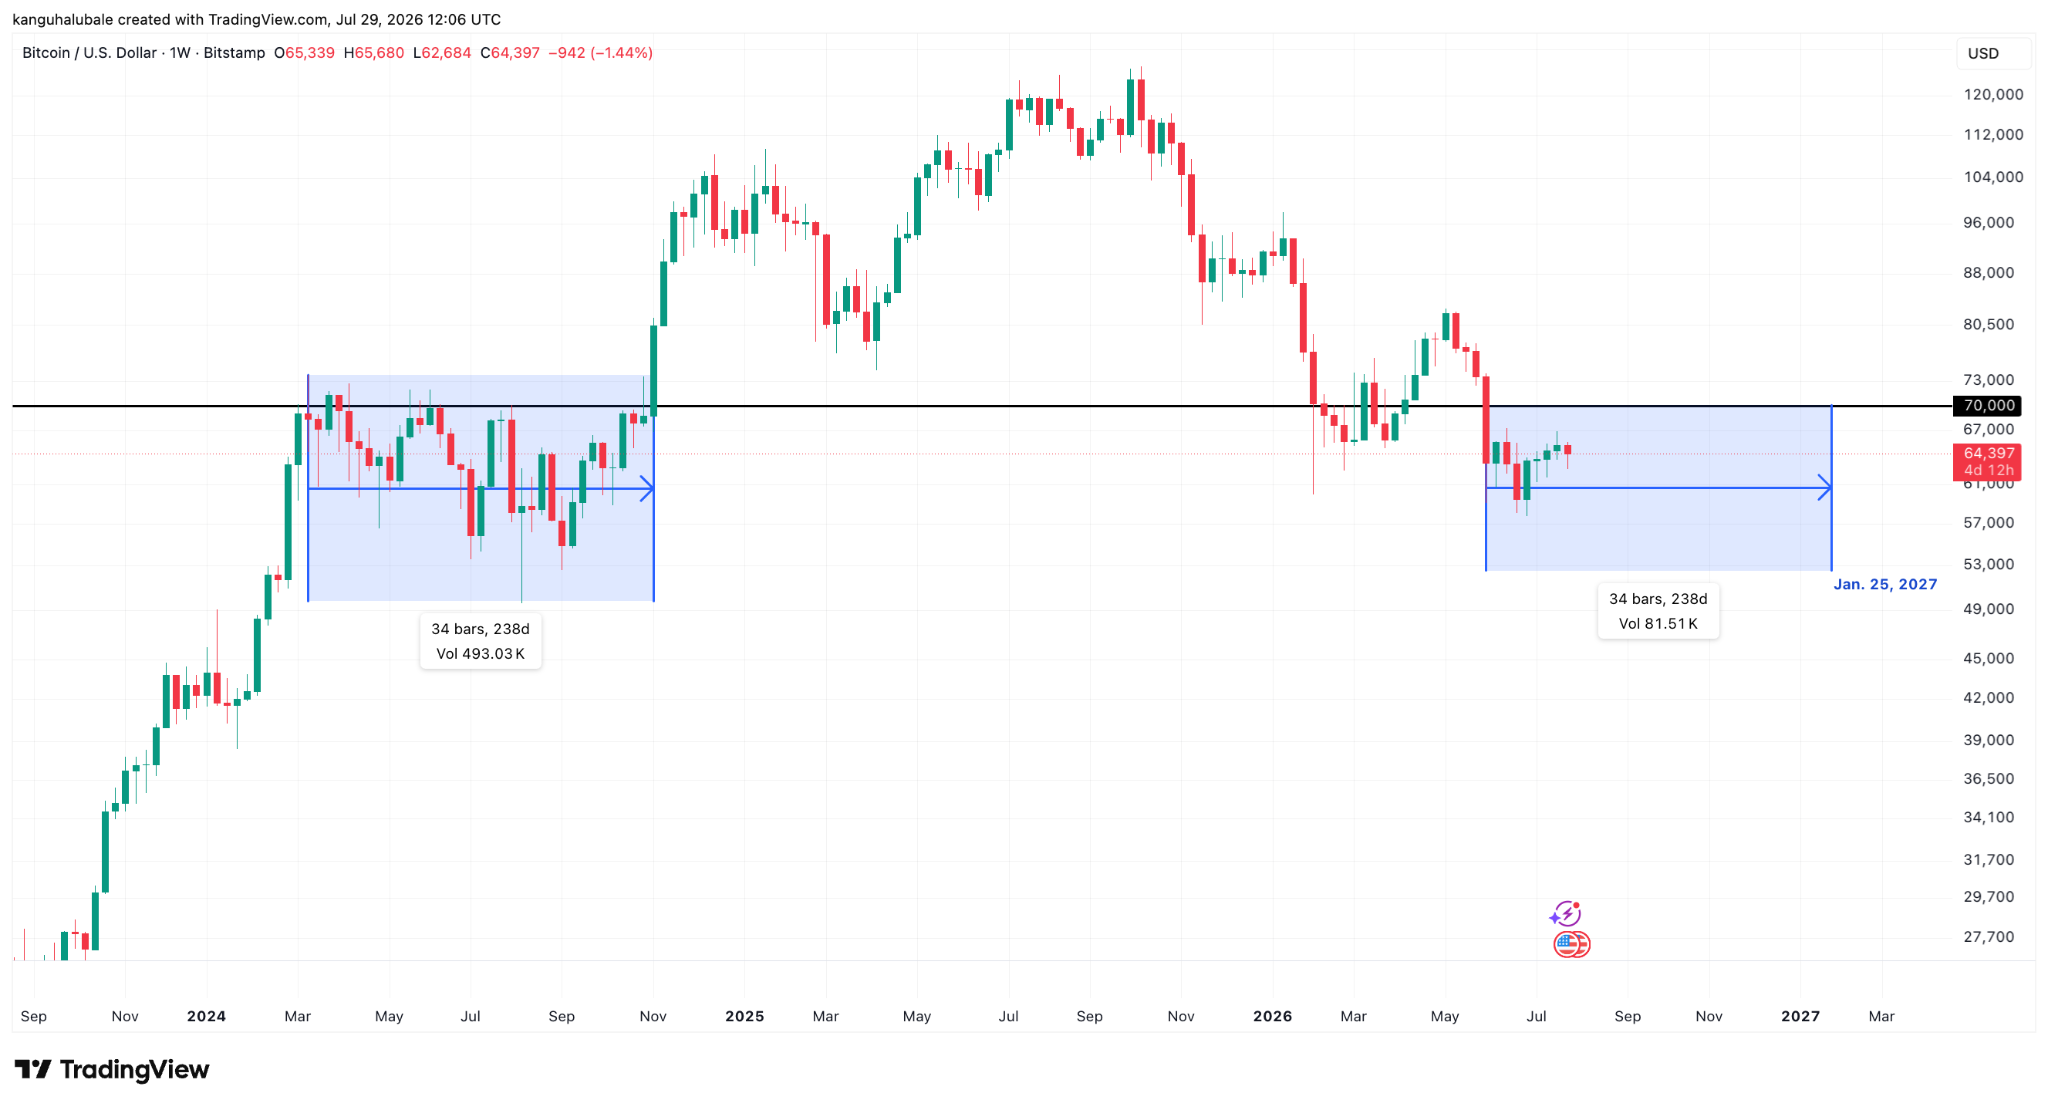
BTC/USD daily chart. Source: TradingView
However, traders on Kashi say the chances of Bitcoin hitting $70,000 before Dec. 31, 2026 are only 12.9%.
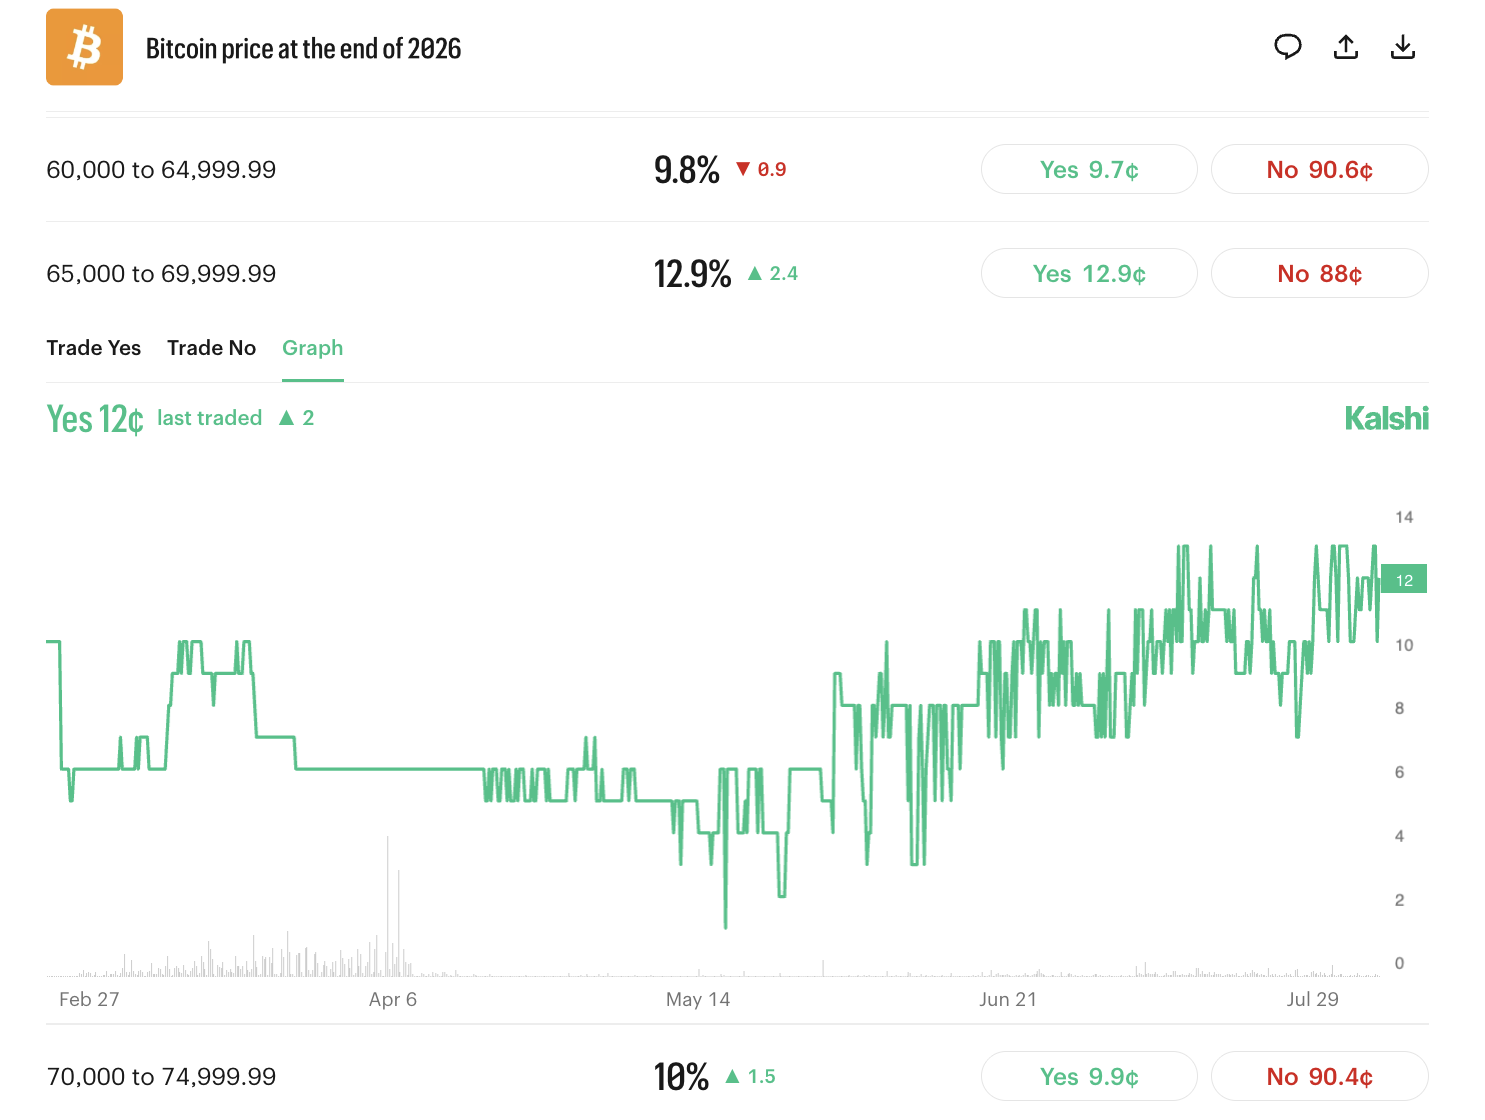
Bitcoin price at the end of 2026. Source: Kalshi
In fact, traders on Polymarket see 65% odds of BTC dropping below $60,000 first, before returning to $70,000 in 2026. Kalshi bettors price in 61% odds that Bitcoin will bottom out at $55,000 this year. Furthermore, the probability of it going to $50,000 is 44% and going as low as $45,000 is 35%
Bearish Chart Signals Reflect Ongoing Downward BTC Momentum
Multiple data points suggest that Bitcoin is in a bear market, with bear targets as low as $40,000.
Data from TradingView captured ongoing BTC price gains, up 1.5% on the day to trade at $64,300, as $65,000-$76,000 settled in as new resistance.
The BTC/USD pair has formed a bear flag on the weekly chart, as shown in the figure below. This bear flag formed following Bitcoin’s drop from $82,800 highs on May 4, and the recent rebound was rejected from the flag’s middle boundary around $65,500.
A daily candlestick close below the flag’s lower boundary at $62,450 will open the way for a drop toward the measured target of the pattern at $43,588. Such a move would represent a 32% drop from the current price.
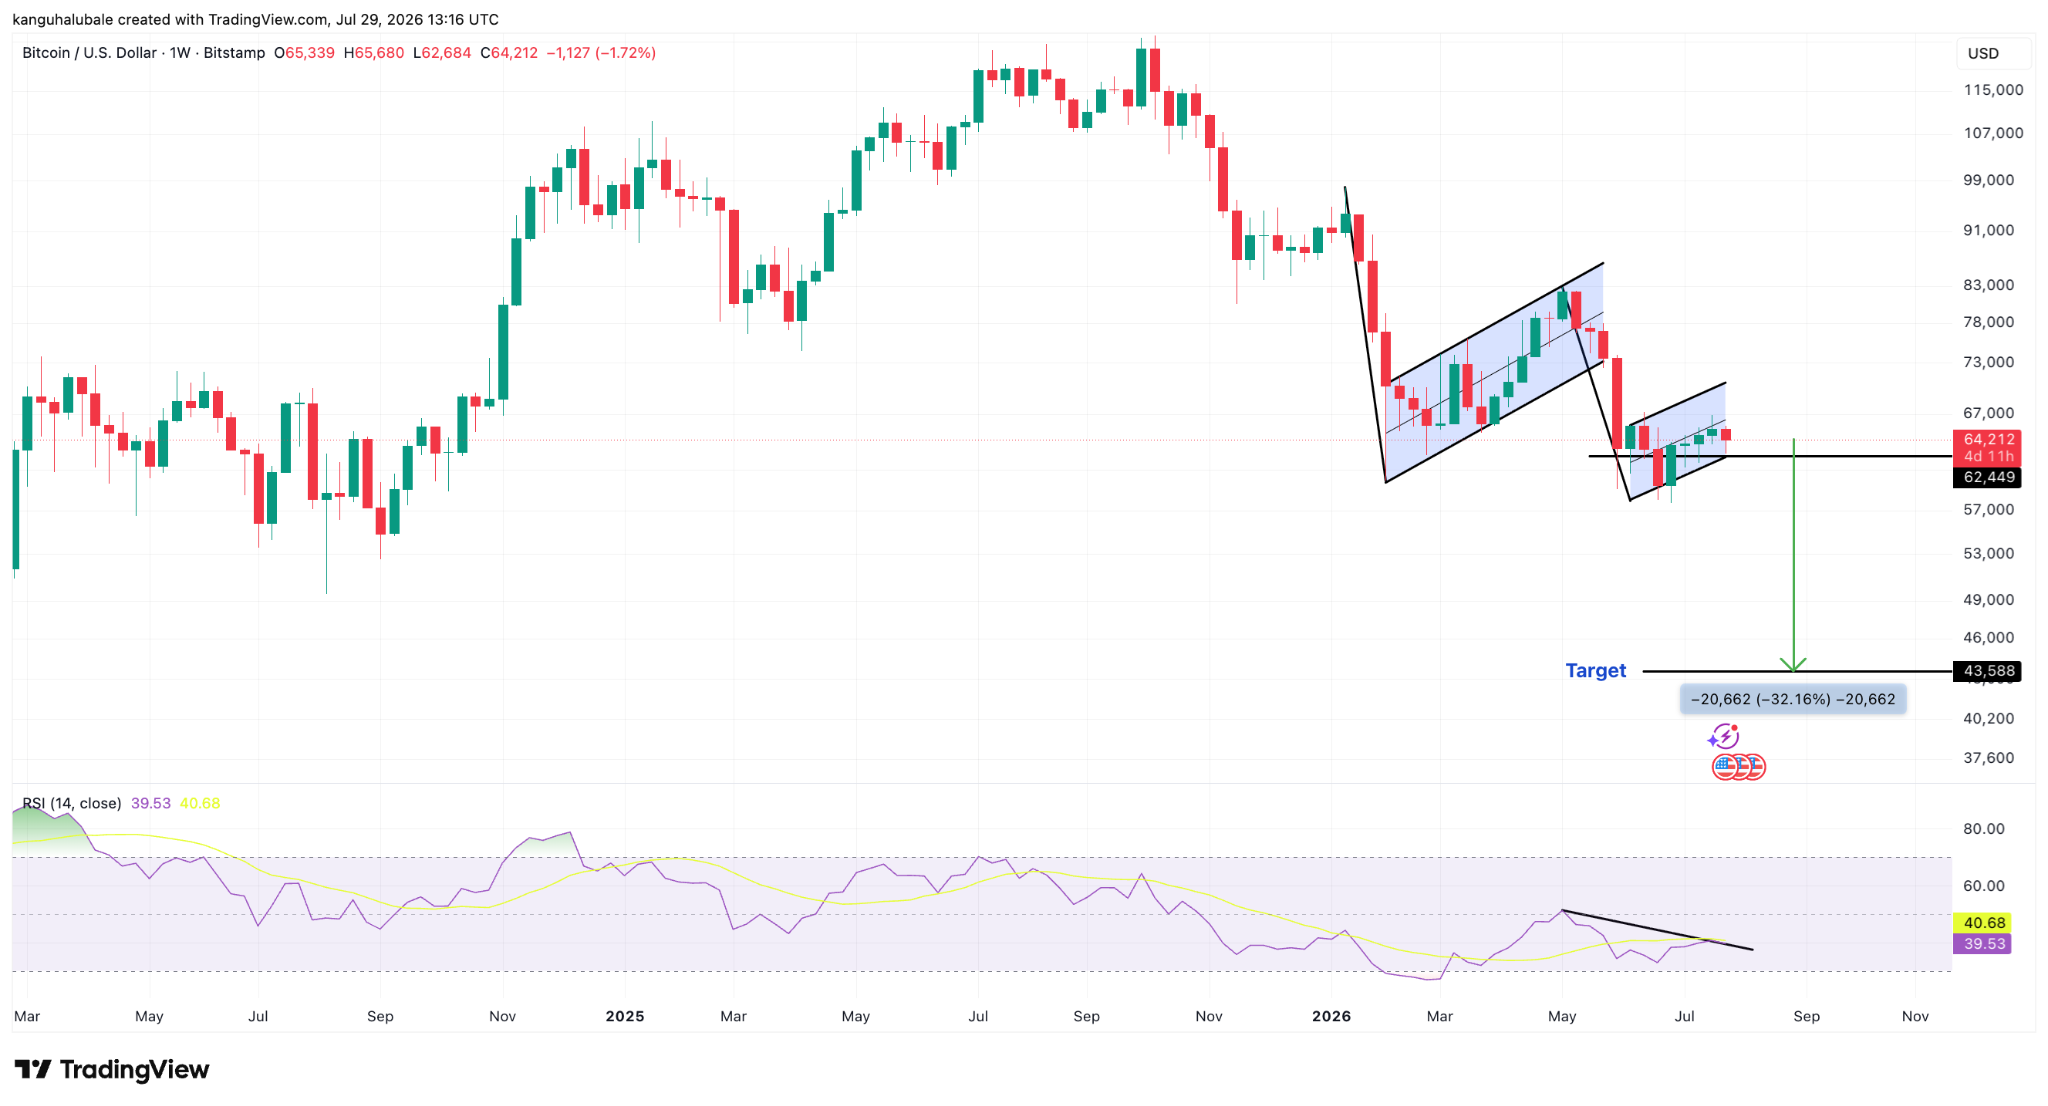
BTC/USD weekly chart. Source: TradingView
This weakness is also reinforced by the downward sloping relative strength index (RSI), which has dropped to 39 from 52 in early May. The decrease in the RSI suggested increasing bearish momentum, adding credibility to the downward outlook.
Outflows from spot Bitcoin exchange-traded funds (ETFs) reinforce BTC’s bearish case. Data from UK trading firm Farside Investors show that US-based spot BTC ETFs have recorded outflows over the last four trading days, totaling $515 million.
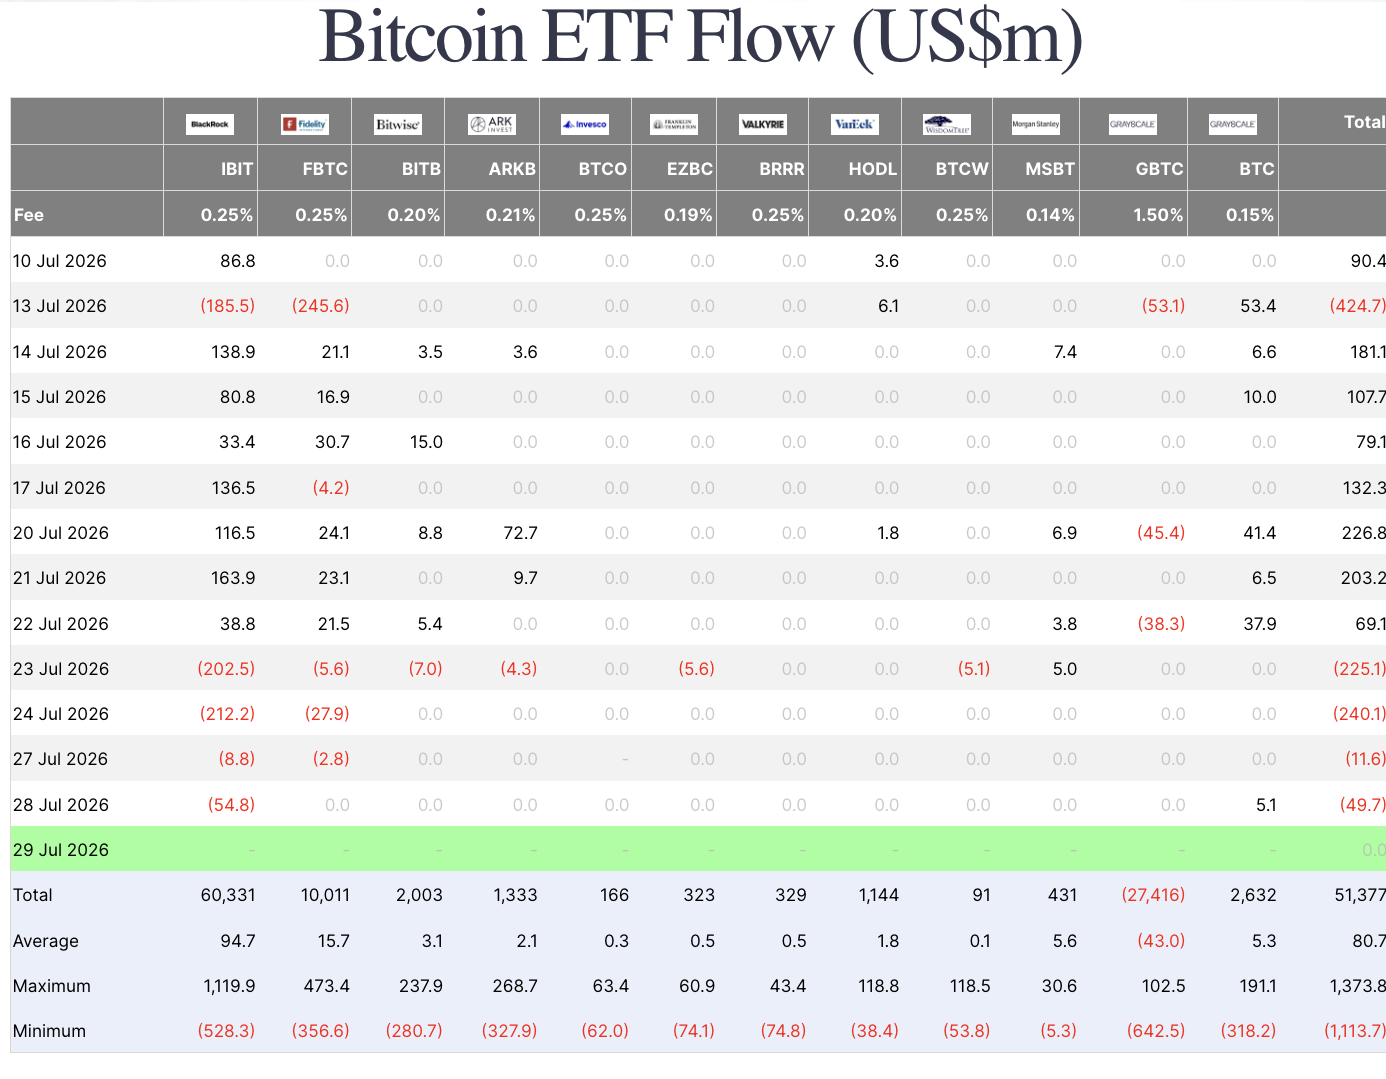
Spot Bitcoin ETFs flows table. Source: Farside Investors
Increasing spot Bitcoin outflows signal waning institutional demand. When investors redeem shares from spot BTC ETFs, fund managers typically sell underlying Bitcoin holdings to meet redemptions. The $515 million outflow over four days reflects net selling pressure from large players, reducing buying interest and adding downward momentum to BTC’s price. This often precedes or accelerates further declines as market sentiment turns negative.
Ready to trade our analysis of Bitcoin? Here’s our list of the best MT4 crypto brokers worth checking out.