


Bearish view
Sell the BTC/USD pair and set a take-profit at 60,000.
Add a stop-loss at 67,000.
Timeline: 1-2 days.
Bullish view
Buy the BTC/USD pair and set a take-profit at 67,000.
Add a stop-loss at 60,000.
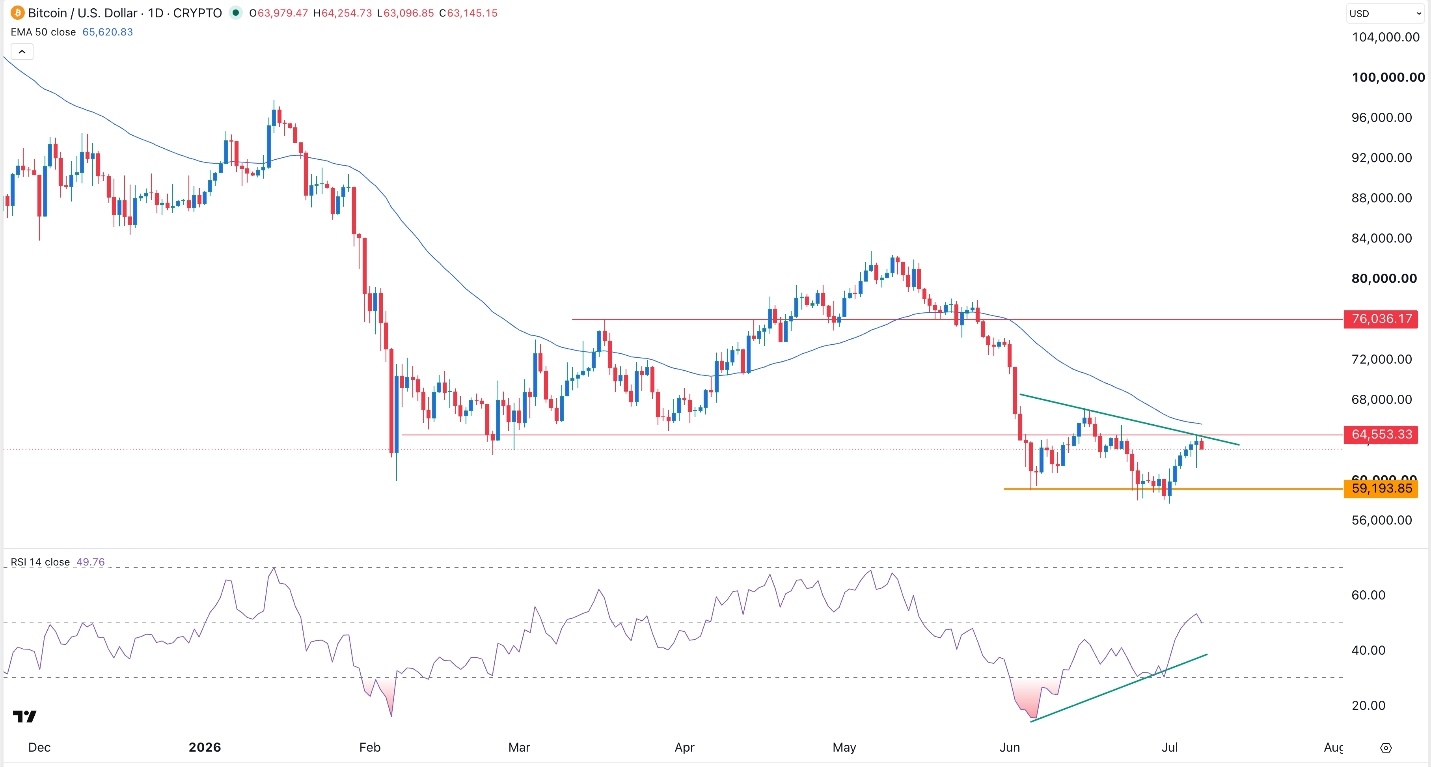
Bitcoin price stalled at a crucial resistance level as geopolitical tensions rose and as jitters on Michael Saylor’s sales continued. The BTC/USD pair was trading at 63,800, up modestly from the year-to-date low of 58,000.
Top Regulated Brokers
Bitcoin Price Wavers as Concerns Remain
The BTC/USD pair wavered amid rising inflation concerns as energy prices jumped. Data shows that Brent jumped to $75, while the West Texas Intermediate (WTI) rose to $69. This surge happened after the US revoked waivers for Iran to sell its oil following its recent attacks of ships crossing the Strait of Hormuz.
By ending the waivers, it means that the memorandum of understanding has largely been revoked, which may push Iran to close the Strait of Hormuz again. As a result, the resumption of fighting would raise inflation concerns, which may push the Federal Reserve to either hike interest rates or leave them unchanged.
These fears explain why the US Dollar Index (DXY) jumped to $101.050 from this month’s low of $100.50. US bond yields also jumped while American equities retreated.
There are also concerns that many private and publicly traded companies that hold Bitcoin may start selling. Strategy has started unloading coins worth over $1.5 billion to fund dividends to holders of its preferred stocks like STRC and STRK.
On the positive side, there are signs that spot Bitcoin ETFs are gaining traction as the Crypto Fear and Greed Index rises. These funds have added assets this month after shedding over $4.9 billion in June. There are also signs that the Crypto Fear and Greed Index has started rising.
BTC/USD Technical Analysis
The daily chart shows that the BTC/USD pair wavered at 63,800 on Wednesday. This is an important level as it coincides with the descending trendline that links the highest swing since May 11 this year.
The pair has also failed to move above the 50-day Exponential Moving Average (EMA). Also, the Average Directional Index (ADX) has dropped from 46.46 in June to the current 28.63, its lowest level since June 2nd.
Therefore, the pair will likely resume falling in the near term, potentially to the psychological level of 60,000. A move above the 50-day moving average of 65,645 will point to more gains, potentially to 70,000.
Ready to trade our free daily Forex trading signals? We’ve shortlisted the best MT4 crypto brokers in the industry for you.