


King Crypto’s market structure has shifted noticeably after a sharp recovery from the weakness seen earlier in between May and mid-August. What initially looked like another attempt to stabilize has developed into a broader rebound, bringing longer-term technical levels back into focus.
Top Regulated Brokers
The question now is whether the move represents a durable change in momentum or simply a powerful recovery within a larger range within the broader bear market. The answer could depend on Bitcoin’s monthly close for August, whether buyers can defend the levels reclaimed during the recent rally and whether onchain activity confirms the improvement in price structure.
With the BTC/USD pair trading at $78,500 at the time of writing, traders are increasingly looking beyond the immediate rebound and toward the levels that could determine whether the recovery has legs to run higher.
Bitcoin Heads Toward Its Strongest Monthly Close Since November 2024
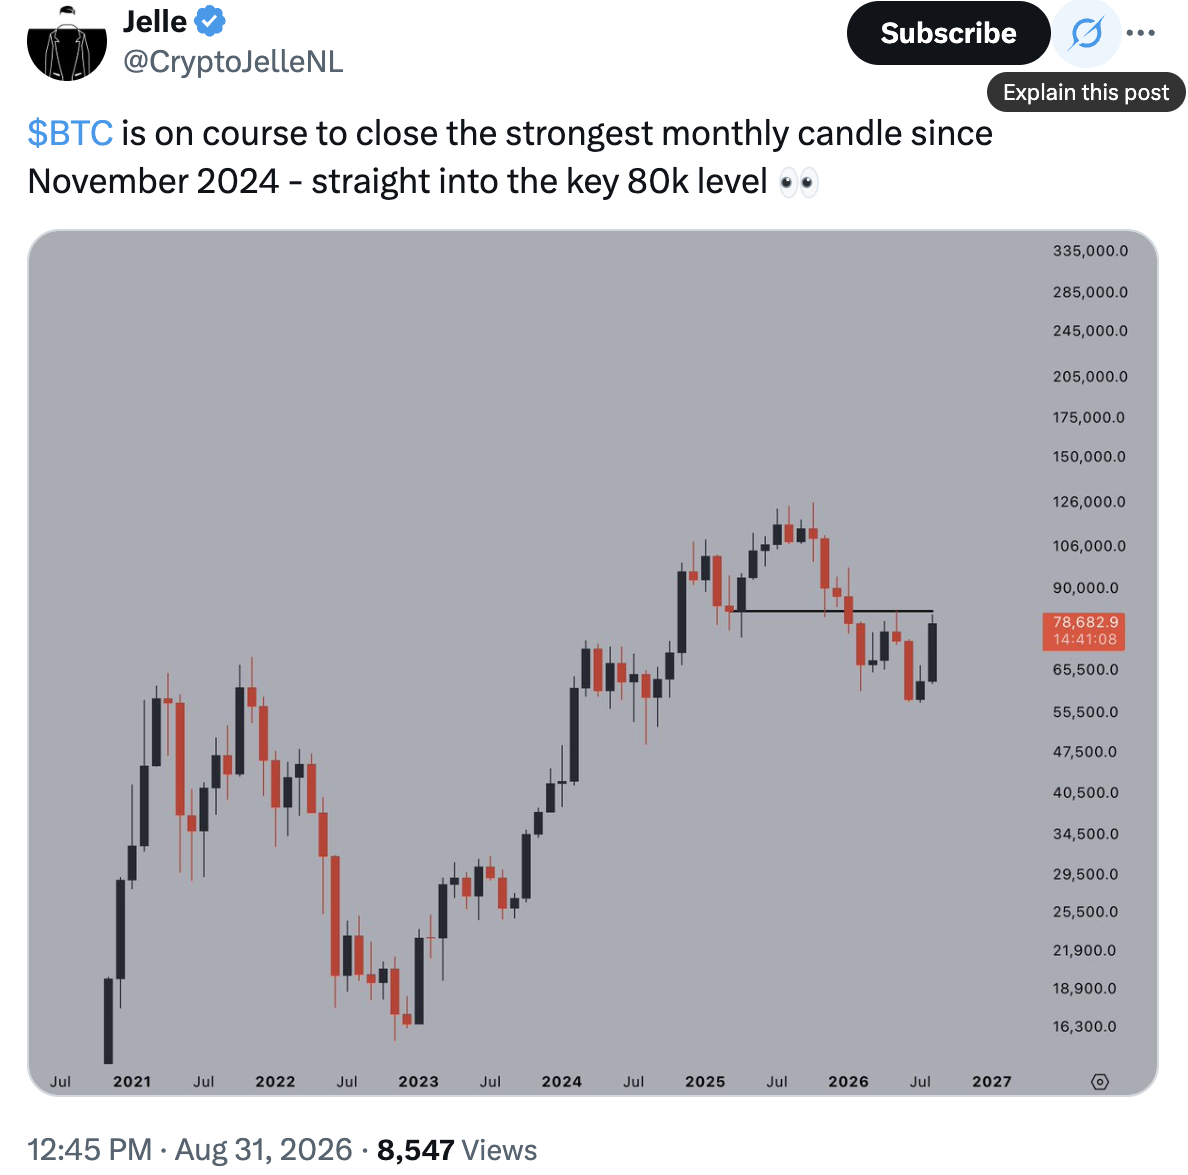
Bitcoin has rallied more than 30% from its mid-August low near $62,200, briefly reaching above $81,400 on Aug. 28. The move has made August Bitcoin’s strongest monthly performance since November 2024, when BTC gained more than 37% and closed near $96,450.
Data from TradingView shows that BTC/USD climbed more than $18,000, with the rally accelerating after BTC reclaimed its 200-day simple moving average (SMA), currently at $65,000.
Highlighting the move, analyst CryptoJelle said Bitcoin is on “course to close the strongest monthly candle since November 2024” as it courts the $80,000 level.
Source: CryptoJelle/X
The significance of the monthly candle is less about the percentage gain itself and more about what it says about market participation. A strong close after such a rapid recovery would show that buyers have been able to absorb supply substantially above the levels that dominated trading earlier in the month.
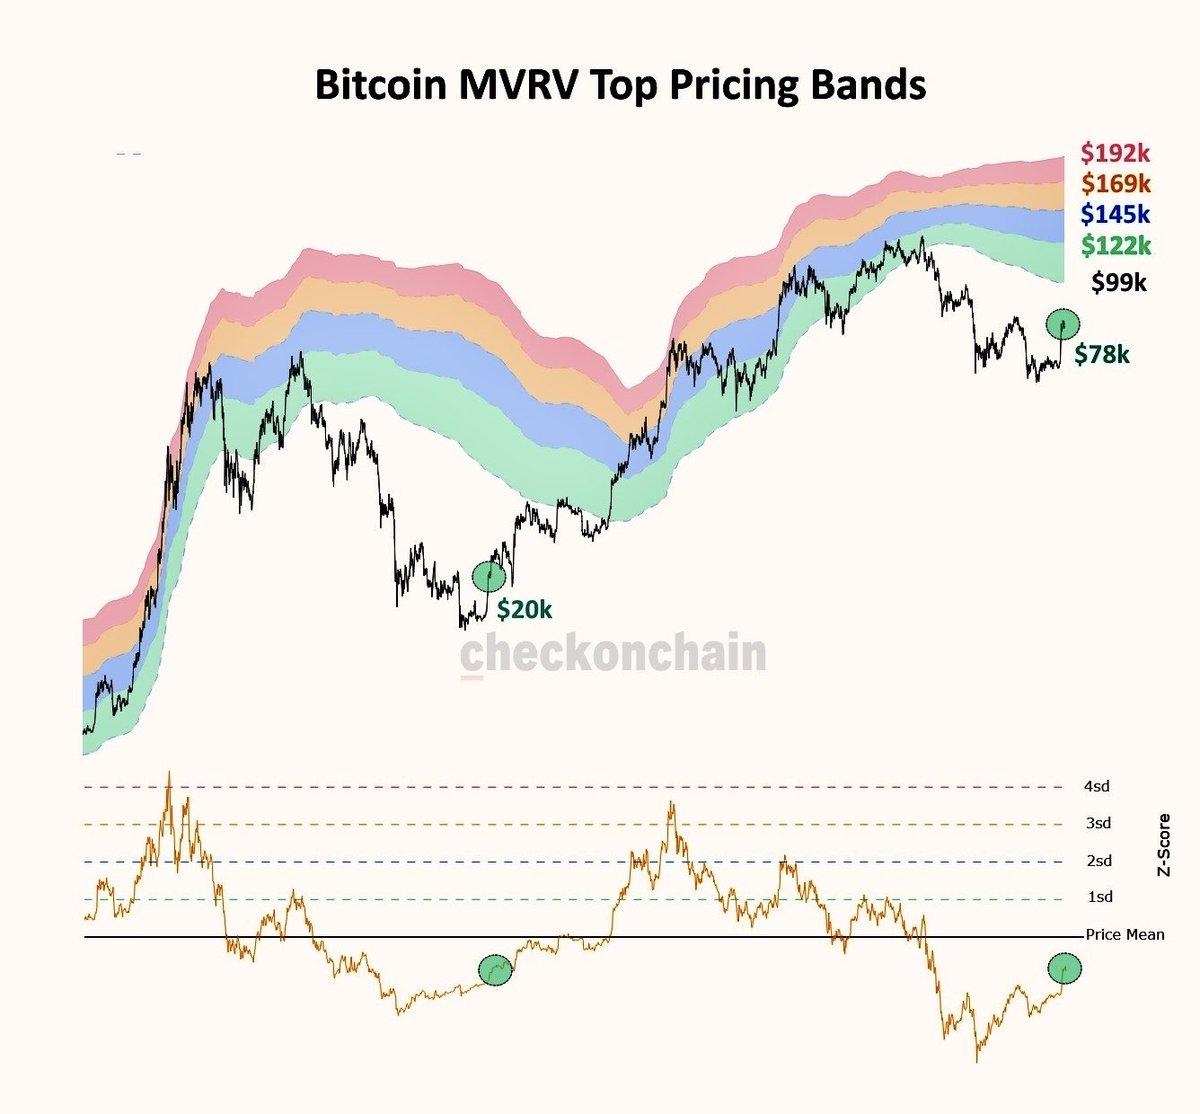
Watching the same transition, fellow Bitcoin analyst Frank Feter said Bitcoin was in the early stages of the bull market based on the MVRV pricing bands.
Bitcoin MVRV pricing bands. Source: Checkonchain
The chart above shows that the MVRV z-score is at the same level it was in 2022 when Bitcoin had risen from the bear market bottom at $15,500 before rising 524% to the current all-time high above $126,000.
The recovery, however, does not automatically establish a new bull trend. Bitcoin remains below its previous record highs, while the move above $80,000 has already encountered some selling. As of Aug. 31, BTC was trading around $78,500 after pulling back from the recent $81,000-plus peak.
That leaves the monthly close particularly important. A close near current levels would preserve much of August’s momentum, while a deeper retreat before month-end would create a different interpretation of the candle.
H2 Bitcoin’s Bull Pennant Points Toward the $104,000 Area
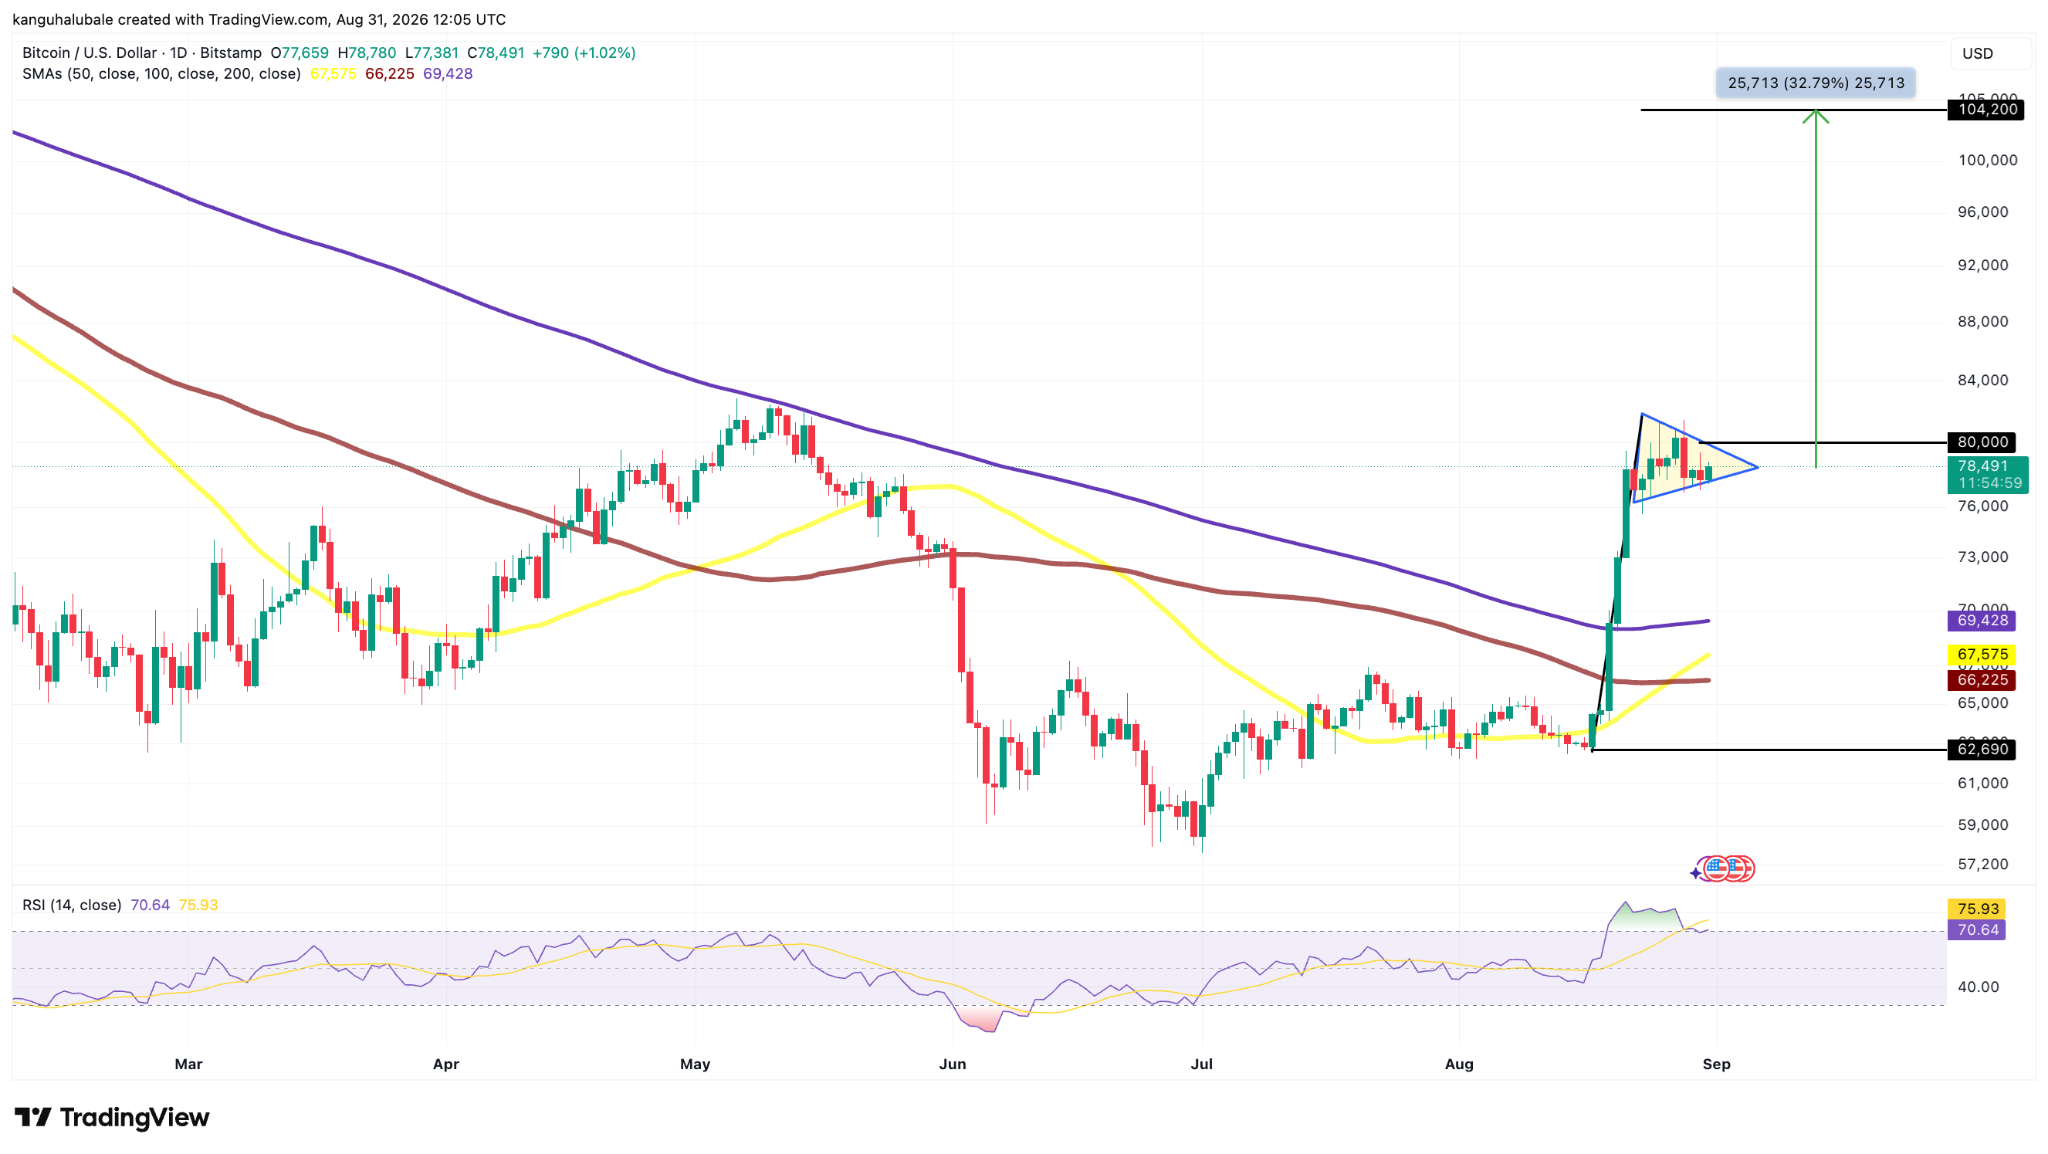
The daily chart offers a more constructive framework. Bitcoin is consolidating inside a bull pennant, which projects a massive upward if the breakout structure remains intact.
A bull pennant forms after a sharp price rise, followed by a brief downward or sideways consolidation within a triangle. It is confirmed when the price breaks above the upper trendline of the pennant, with a strong upward volume. The target is typically calculated by adding the flagpole’s height to the breakout price, projecting the potential advance.
As such, a daily candlestick close above the pennant’s resistance line at $80,000 would open the path toward the measured target of the prevailing chart pattern at $104,000.
BTC/USD daily chart. Source: TradingView
But the measured target should be viewed as a technical projection rather than a forecast. The pattern only remains constructive if Bitcoin can sustain the breakout and avoid falling back into the prior consolidation range.
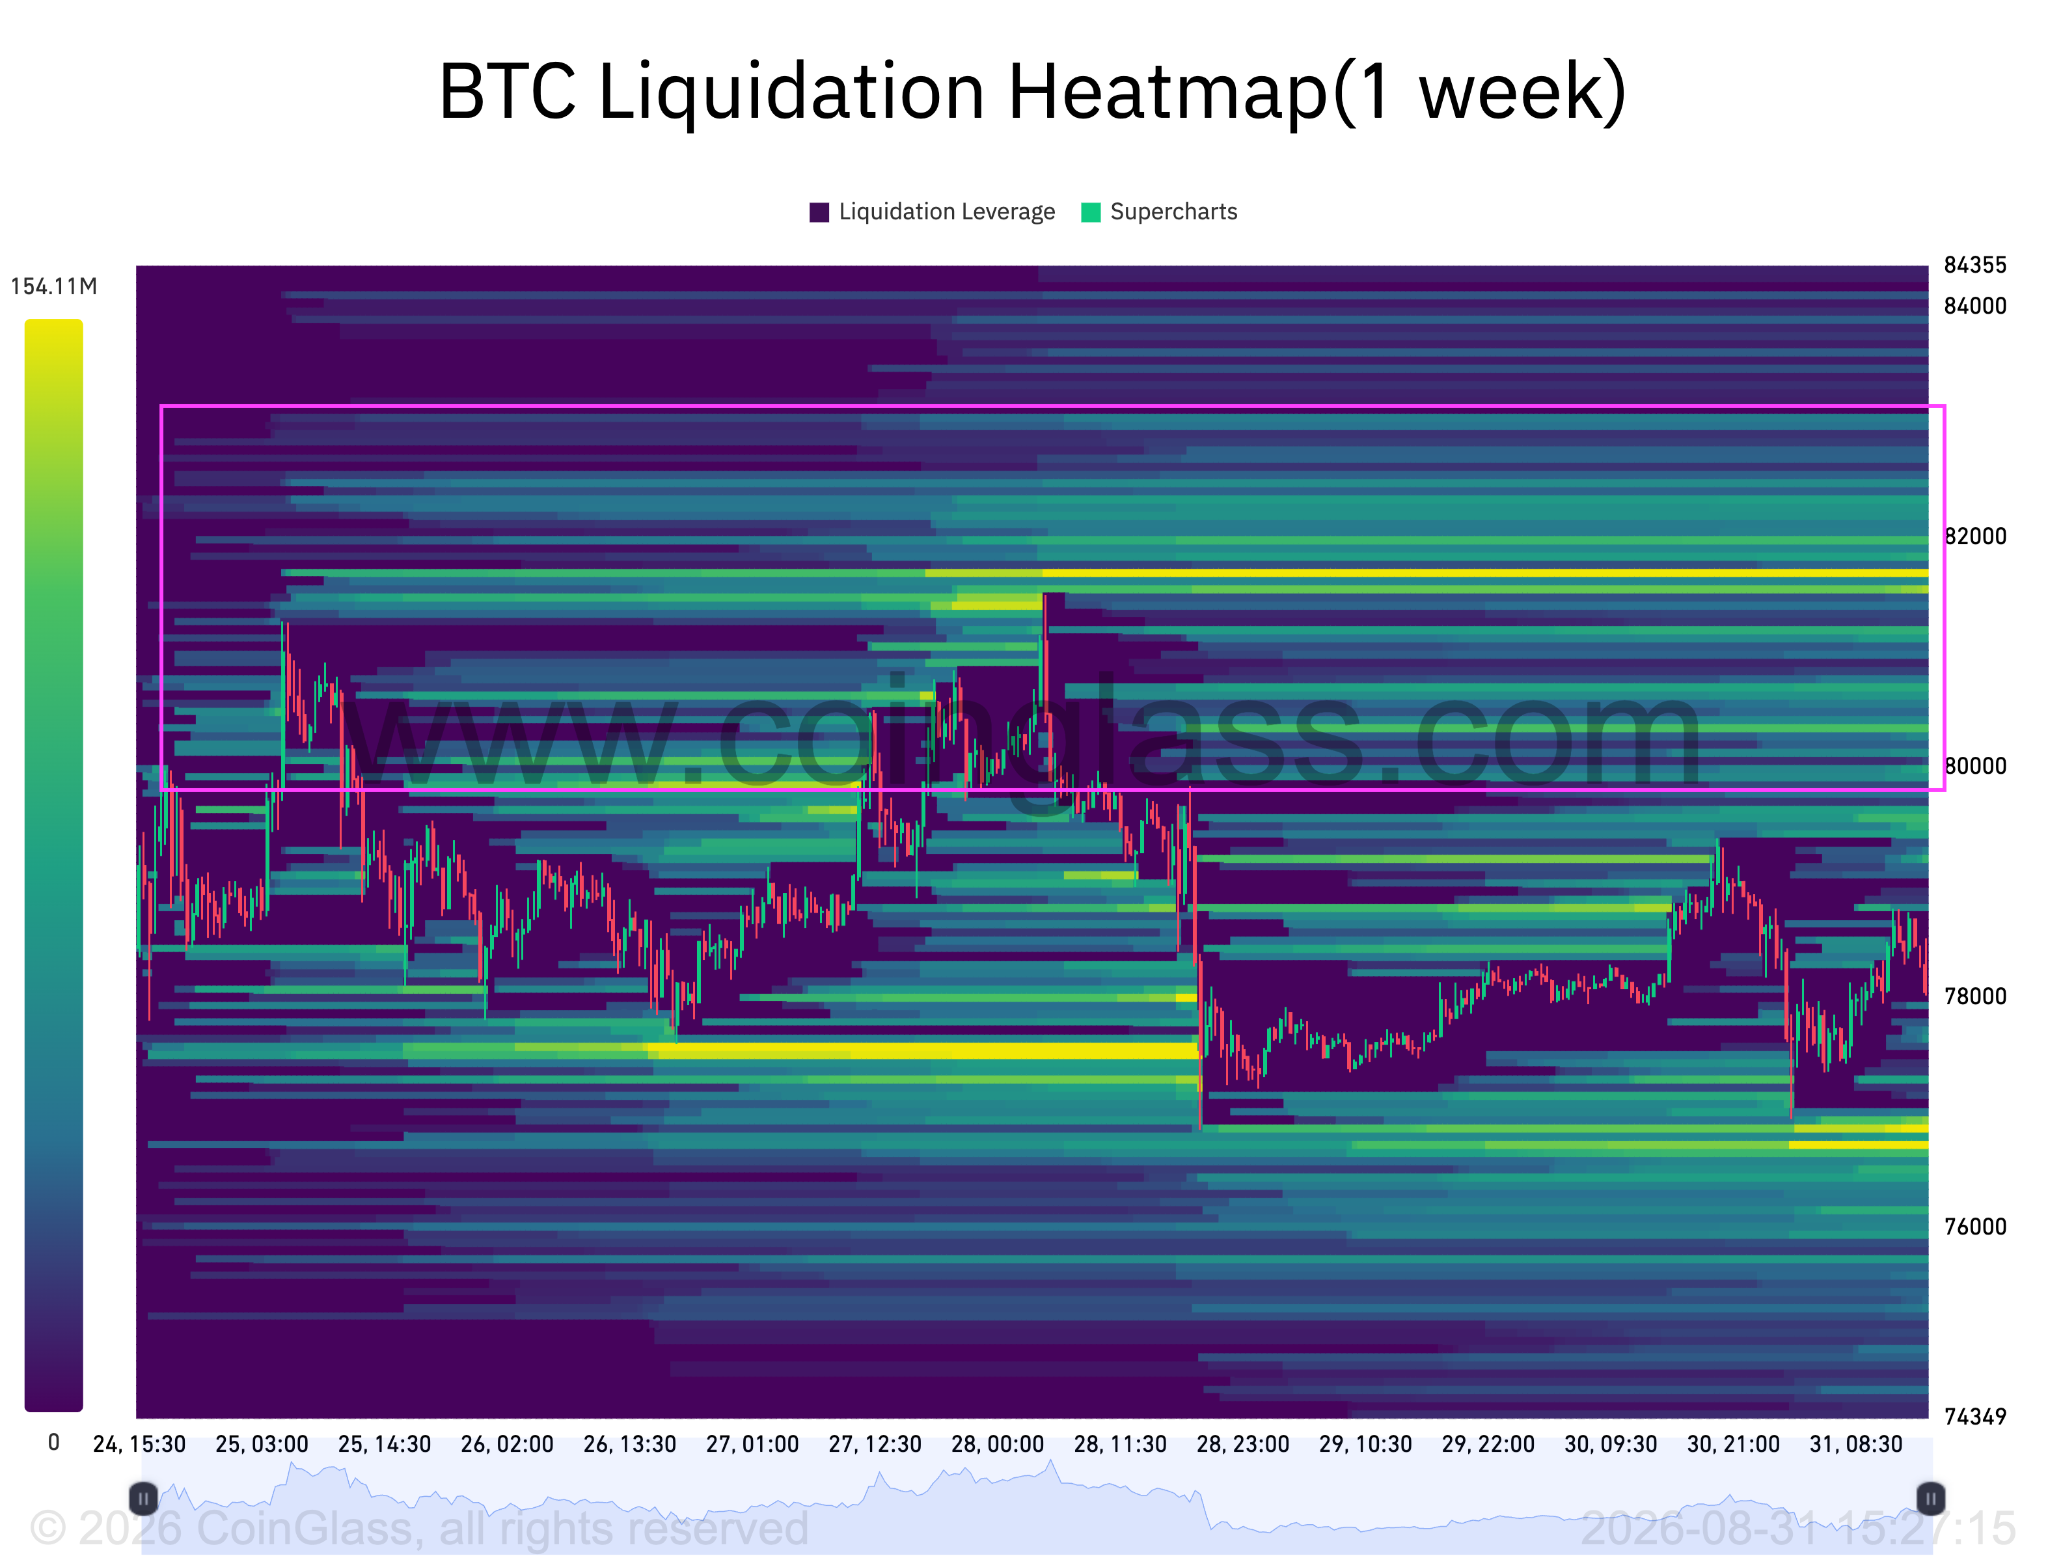
This distinction becomes particularly important when liquidity is considered. Order books can contain significant sell-side liquidity above the market, particularly around previous reaction highs and psychologically important round numbers.
Technical Setup: Bull Pennant Structure and Resistance Levels
Bitcoin’s liquidation heatmap shows large clusters of ask orders building up to $83,000. If BTC/USD pushes through these orders, it could add momentum to its breakout. If sellers absorb the buying instead, the price could return toward lower liquidity pools, sitting all the way down to $74,000 before making another attempt at recovery.
Bitcoin liquidation heatmap. Source: CoinGlass
Continued whale accumulation, healthy profit-taking behavior and stable long-term holder supply would strengthen the case that the rally is being supported by organic demand rather than primarily leveraged positioning.
The bullish scenario, therefore, depends on several pieces aligning. Bitcoin would be required to break and hold above the 50-week SMA at $80,000, maintain constructive weekly momentum and continue attracting spot demand.
The alternative is a rejection near the recent high, followed by a move back below the breakout structure. Such a move would suggest that August’s rally remains a relief rally rather than a confirmed long-term trend reversal.
The August Close as a Watershed for Bitcoin Participation Signals
August's monthly close functions as more than a technical milestone—it represents a participation inflection that determines capital allocation vectors for institutional players heading into Q4. The bull pennant structure that has emerged during the August recovery now bridges two competing narratives: either the consolidation phase that dominated 2024 is genuinely breaking down into a new accumulation regime, or the relief rally merely extends existing sideways confinement. This distinction matters systemically because spot ETF capital, regulatory clarity windows following recent policy signals, and margin positioning all pivot on whether August resolves structural or tactical. The $80,000 level anchors this interpretation; sustained positioning above it suggests institutions are repositioning for higher participation, while failure exposes the recovery as retail-only and ephemeral.
For now, Bitcoin’s monthly candle is carrying more information than simply a large percentage gain. The pending close will show whether buyers can preserve the strongest monthly momentum seen since late 2024, while the daily structure will determine whether the $104,000 projection remains technically relevant.
Ready to trade our analysis of Bitcoin? Here’s our list of the best MT4 crypto brokers worth checking out.