


The GBP/USD currency pair has been trading sideways for about fifteen months, so it is fair to say that it has been a stable currency pair. Drilling down into the currencies involved in a pair is always an important part of trying to find out what is going on with it, and it remains true that the US Dollar is the primary driver of major currency pairs. The US Dollar is continuing to trade lower after briefly breaking out to a new long-term high price a few weeks ago. Yet even as the price of the GBP/USD currency pair and the US Dollar index remain within familiar ranges, it is worth asking whether the lack of directional movement might actually be an advantage for retail traders rather than a barrier to profit.
Why GBP/USD’s 1.3400–1.3500 Range Matters for Day Traders
The first thing worth noting about current events affecting this currency pair is the continuing weakness in the US Dollar, which will tend to allow the price of the GBP/USD currency pair to trade higher. However, after zooming out to look at the big picture, it is easy to see that the price of cable remains near the centre of its range of the past fifteen months, which on first sight presents a dull picture for traders. This seeming dullness is reinforced by the increasing number of obvious support and resistance levels which can be drawn near the current price on the chart.
When the price looks so bogged down, is precisely when it is easy to find high probability scalps, or when a serious directional move might begin to get underway. So, what are the chances of these scenarios playing out?
Top Regulated Brokers
GBP/USD Technical Outlook: Neutral Scalps or Bullish Breakout Above 1.3500?
We have seen the standout level in the price chart below – the resistance confluent with the big round number at $1.3500 – continue to hold, and although the recent high was a little below it, print price action somewhat resembling a bearish double top. However, that bearish technical is contradicted by the strong move down by the US Dollar Index (DXY) from the key resistance level at 101.39. The latter would suggest a move higher is possible, but almost everything in the cable chart suggests deadlock. The only other factor that does not is the general move higher over the past week, although that move looks like it has run out of steam.
The sense of deadlock is reinforced by the several support and resistance levels close by, almost all of which look likely to hold. Taken as a whole this suggests that the best approach here will be to remain open to scalping either long or short depending upon price action producing firm rejections of any key level.
The strongest levels look to be the ones that are confluent with the round number at $1.3400 and $1.3500. The levels between the round numbers look considerably more questionable.
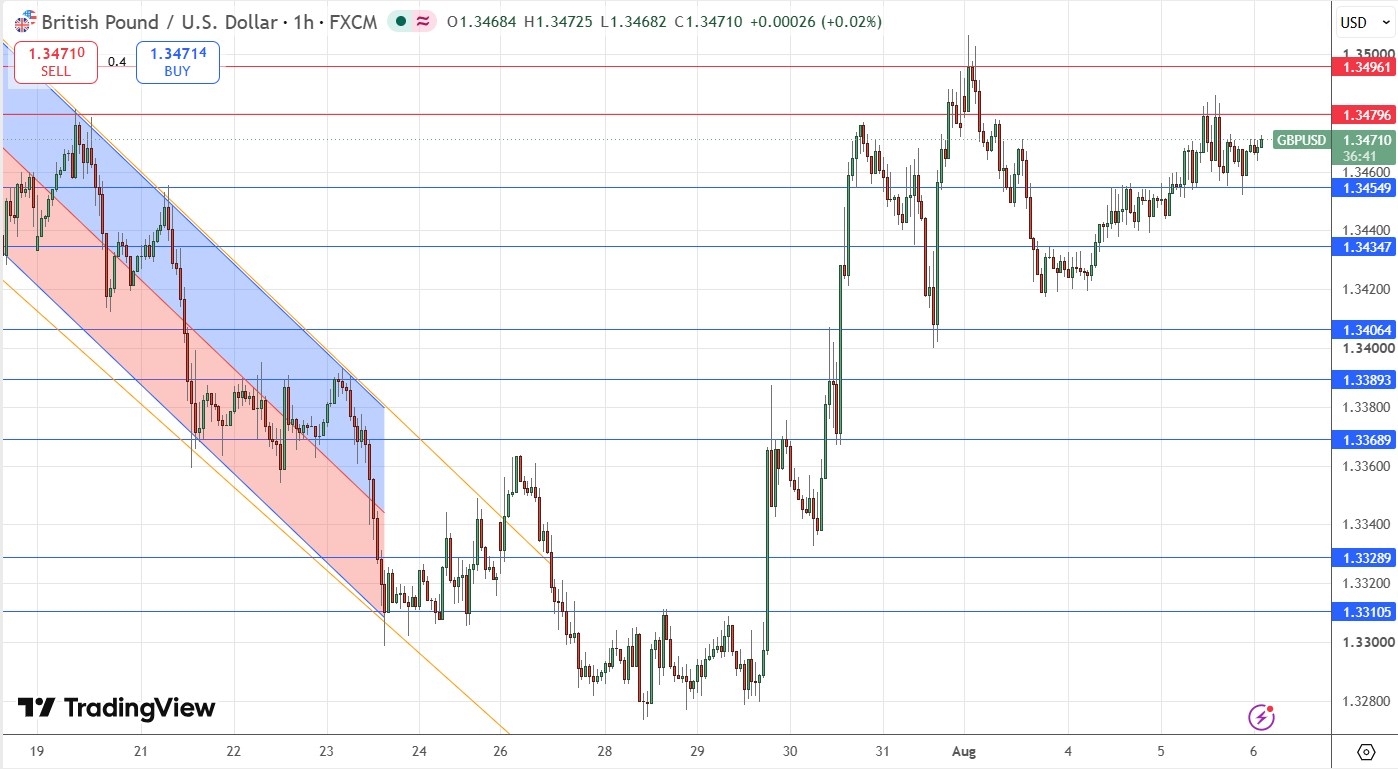
GBP/USD Hourly Price Chart
Hidden Risks for GBP/USD: Thin August Liquidity and US Dollar Surprises
There are two major issues that my analysis so far might be underestimating or even ignoring.
Firstly, the economic calendar has been extremely quiet this week, with no major data releases at all due today or taking place yesterday. There is important US data due on Friday, so it could be that liquidity is very thin in the market right now, and this would suggest that the recent price action is of no importance at all. Having said that, volume seems to be normal for the time of year, but it is August, which tends to be a thin month in the market.
Secondly, and probably more worth considering, something surprising might happen with the US Dollar, such as a sudden statement by an FOMC member which might shift rate expectations. This could render the closely packed technical levels completely irrelevant for several hours. If the US Treasury intervenes again to prop up the Yen by selling Dollars, this could send cable higher, easily disregarding $1.3500.
Are Markets Just Asleep Before Friday’s US Jobs and Earnings Data?
Perhaps institutions and other big players in the cable market are mostly just sitting on the sidelines ahead of the average hourly earnings, non-farm payrolls, and unemployment rate data due in the USA this coming Friday. This is an important even in the USD calendar every month, and even if the data do not trigger any change in market sentiment, major players planning big trades will often wait until that is confirmed by the data, so USD markets often move at that time.
If correct, this would suggest that there is very little point trading this currency pair before Friday’s New York session gets underway.
What’s Next for GBP/USD After Friday’s Data and the 1.3500 Test?
Despite the risks and the fact that we are in the typically thin month of August, I think this pair should still be interesting to day traders, even before Friday’s US data.
As has been the case for several days, a bullish breakout beyond $1.3500 would be supported by the medium-term trend lower in the USD and would be psychologically significant. However, another failure at this potentially pivotal level might be easier to trade.
After Friday’s data, a test of $1.3500, whether successful or failed, will have greater significance.
Ready to trade our GBP/USD analysis? Here is our list of the best Forex brokers worth reviewing.