


We have reached an interesting moment for the GBP/USD currency pair where the bullish case has become increasingly convincing for a few reasons, most notably last week’s relatively high UK CPI (inflation) print. However, the US Dollar has firmed somewhat over recent days, or at least refused to fall any further, despite indicating short-term bearish momentum over both its immediate and three-month trends. Despite that, we see a clearly bullish technical picture which is starting to look decisive.
The GBP/USD currency pair is certainly going to be in the focus of Forex analysts today.
Top Regulated Brokers
British Pound Remains a Strong Currency
There is no obvious proximate cause, but we’ve seen a muted strength in the British Pound continue over recent multi-month periods. In fact, the British Pound is one of the very few currencies, and the only major currency, which has recently made a new long-term high against the US Dollar – I define long-term as six months plus.
The US Dollar has firmed but remains susceptible despite more hawkish rhetoric coming from some members of the Fed. This is probably overblown, hence the greenback’s continuing volatility.
There is not much in the way of important data releases today, so trading in the Forex market is likely to be mostly technical and speculative.
Survival of Support at 1.3618 a Bullish Indicator
There are several major technical factors pointing to a likelihood of higher prices.
Firstly, the bullish breakout above 1.3600 last week, which briefly printed a new 6-month high, has held not only above the round number at 1.3600 but also the nearest key support level above that at 1.3618. As today’s London session got underway, the short term price action also turned bullish after a dip, which was an immediate indication that a further bullish move was imminent.
There is an ascending and symmetrical price channel which held for approximately three weeks, before the price made a bullish breakout above it last week. This is a classic sign of an accelerating bullish trend.
We also see a clear sequence of higher lows over the past month.
Forget about the bearish head and shoulders chart pattern which seemed to be forming late last week – this has been invalidated. The only bearish technical factor visible is the fact that the price has not yet been able to really get established at a 6-month high price, so the 1.3650 area could prove to be resistant again to some extent.
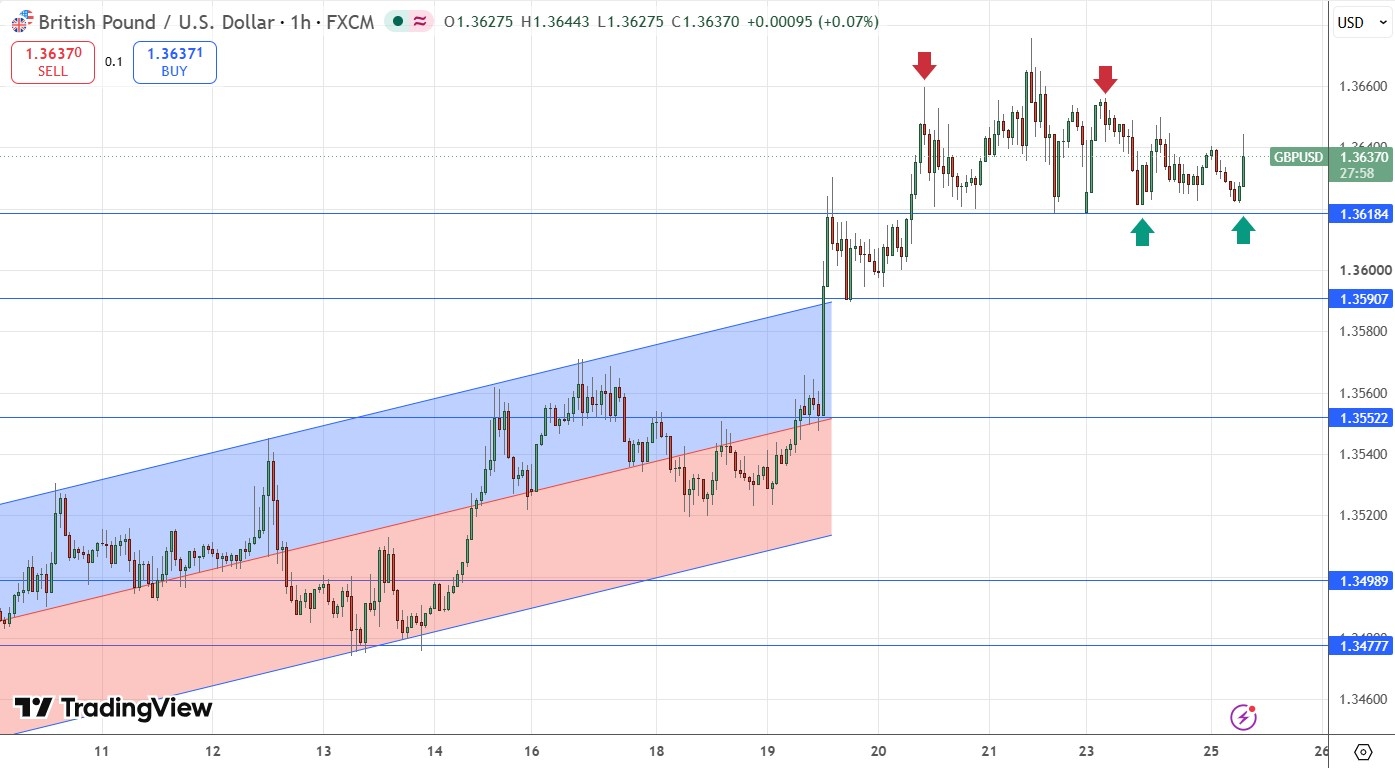
GBP/USD H1 Price Chart
My Take on the GBP/USD
I see the best opportunity here as likely to be on the long side, even if we get a short-term dip to the $1.3618 support area. Buying a dip relatively early in the London session and trying to hold into the New York session seems likely to be the best trade opportunity here today.
Support & Resistance Levels
Risk 0.75%.
Trades may only be entered prior to 5pm London time today.
Long Trade Ideas
Long entry following a bullish price action reversal on the H1 timeframe immediately upon the next touch of $1.3618, $1.3590.
Put the stop loss 1 pip below the local swing low.
Adjust the stop loss to break even once the trade is 25 pips in profit.
Take off 50% of the position as profit when the price reaches 25 pips in profit and leave the remainder of the position to run.
Short Trade Idea
Short entry following a bearish price action reversal on the H1 timeframe immediately upon the next touch of $1.3658.
Put the stop loss 1 pip above the local swing high.
Adjust the stop loss to break even once the trade is 25 pips in profit.
Take off 50% of the position as profit when the price reaches 25 pips in profit and leave the remainder of the position to ride.
The best method to identify a classic “price action reversal” is for an hourly candle to close, such as a pin bar, a doji, an outside or even just an engulfing candle with a higher close. You can exploit these levels or zones by watching the price action that occurs at the given levels.
Ready to trade our free Forex signals? Here is our list of the best Forex brokers worth reviewing.