


Bullish view
Buy the GBP/USD pair and set a take-profit at 1.3700.
Add a stop-loss at 1.3550.
Timeline: 1-2 days.
Bearish view
Sell the GBP/USD pair and set a take-profit at 1.3550.
Add a stop-loss at 1.3700.
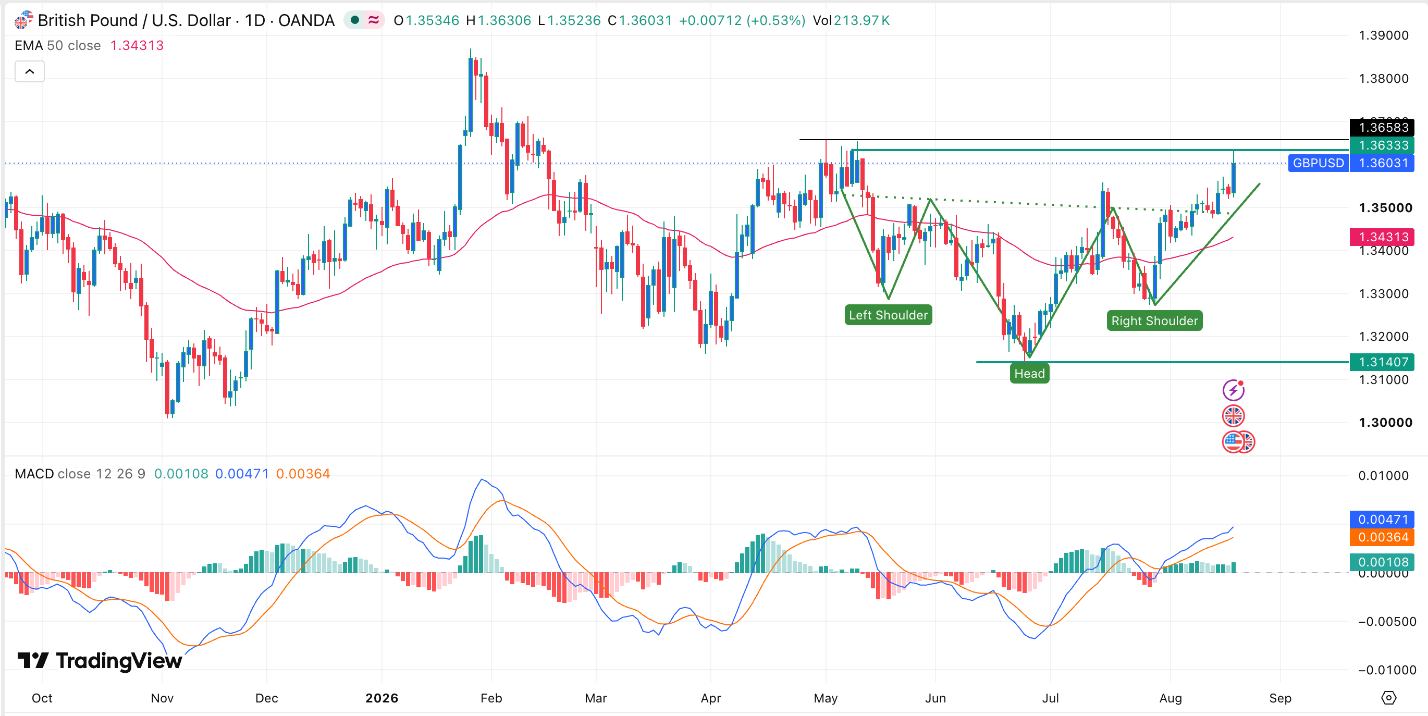
The GBP/USD pair jumped to its highest level since May 11 this year, up by nearly 4% from its lowest level in June this year. It has already formed a golden cross pattern and an inverted head-and-shoulders pattern, pointing to more upside ahead of the UK retail sales data.
Sterling Rally Gains Steam After Fed Minutes
The GBP/USD pair continued its strong rally as the US dollar softened across the board. It soared as US bond yields pulled back after an important intervention by the Treasury Department.
Data shows that the 30-year yield fell to 5.19% from the year-to-date high of 5.336%. This retreat happened after the Treasury Department announced that it would double the size of the government debt repurchases. It will target the 10- to 20-year and 20- to 30-year portion of the market, boosting the purchases from $2 billion to at least $4 billion.
Top Regulated Brokers
The GBP/USD pair also jumped after the Federal Reserve released the minutes of the last monetary policy meeting. These minutes showed that several officials supported hiking interest rates if inflation does not fall. Also, officials deliberated on whether to reduce the number of annual meetings from eight to six.
Traders now have a 50-50 chance that the Fed will hike interest rates later this year as inflation is expected to remain above the 2% target for longer than expected. A key inflation risk is that the US-Iran war has moved into a stalemate with no clear exit strategy.
The GBP/USD pair also reacted to the latest UK inflation numbers. This report showed that the headline Consumer Price Index (CPI) rose from 2.6% to 2.9%, while the core figure remained unchanged at 2.6%. These numbers mean that the BoE may decide to hike rates later this year.
GBP/USD Technical Analysis
The daily chart shows that the GBP/USD pair jumped to a high of 1.3633, its highest point since May. It has formed an inverted head-and-shoulders pattern, a common bullish reversal sign in technical analysis.
The pair has also formed a golden cross pattern, which happens when the 50-day and 200-day Exponential Moving Averages (EMA) cross each other. This pattern often leads to more gains.
Therefore, the path of the least resistance for the pair is bullish, with the next key target to watch being at 1.3700. This view will be confirmed if it moves above the crucial resistance level of 1.3658, its highest point on May 1.
Ready to trade our free trading signals? We’ve made a list of the best UK forex brokers worth using.