


Gold looks calm on the surface, but the market is carrying more uncertainty than the range alone suggests. Traders are weighing competing headlines, uneven economic signals, and a traditionally low-volume period that can make conviction difficult to judge.
The metal remains close to a familiar resistance area, yet repeated tests have not produced a clear break. That hesitation matters because it leaves both sides of the market searching for a stronger reason to take control.
Gold Faces a Crowded $4,500 Resistance Area
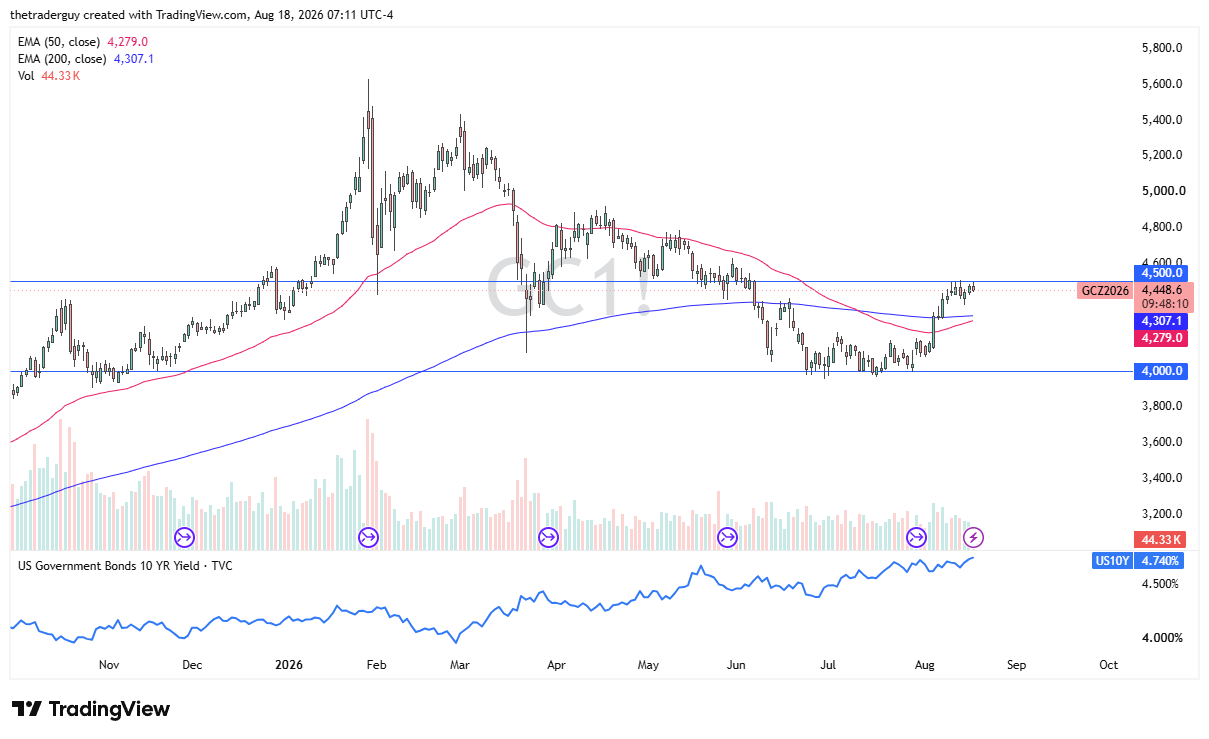
Gold continues to trade sideways just below the $4,500 barrier. The level has been tested several times over the past week, but buying pressure has not been sufficient to push through it. Intraday reactions suggest that a substantial block of orders may be sitting in that area.
A modest pullback would make sense after the recent hesitation and signs of exhaustion; the market has already seen one over the last couple of sessions. Consolidation remains the defining behavior, while rising interest rates work against gold. At the same time, traders are considering whether the Federal Reserve may not need to raise rates as aggressively as previously feared.
Softening US economic numbers add another layer to the debate, while energy inflation could still create disruption. Ongoing tensions in the Middle East also leave financial markets without a particularly clean setup. In that environment, gold’s difficulty at $4,500 is not especially surprising.
Top Regulated Brokers
Moving Averages and Headlines Keep Gold Unsettled
The 50-day EMA sits just below the 200-day EMA and is attempting a so-called golden cross. That is a bullish signal watched by higher-timeframe technical traders, although it remains to be seen whether it gains meaningful influence. Larger traders often use the relationship between these averages to assess the broader trend, and a crossover can attract favorable attention in financial media.
A break below the moving averages would be a negative technical development, while a daily close above $4,500 would be constructive. Because the barrier is so visible to market participants, either outcome could draw increased attention over time.
For now, headline risk remains central. Media threats between Iran and the United States, alongside other geopolitical developments, are contributing to volatility inside a narrow range. The next sessions may show whether this period of consolidation is simply a pause or whether the market needs a more decisive catalyst before it can establish direction.
Review the possible setup in our gold price forecast and decide whether the opportunity matches your strategy. Trade Today's Gold Setup with FP Markets.