


During the month of August, the stock market has had a lot to think about, as we are watching the Strait of Hormuz, interest rates, and a trade war between the USA and Canada. There are plenty of things that could cause wiggles along the way.
Top Regulated Brokers
NASDAQ 100
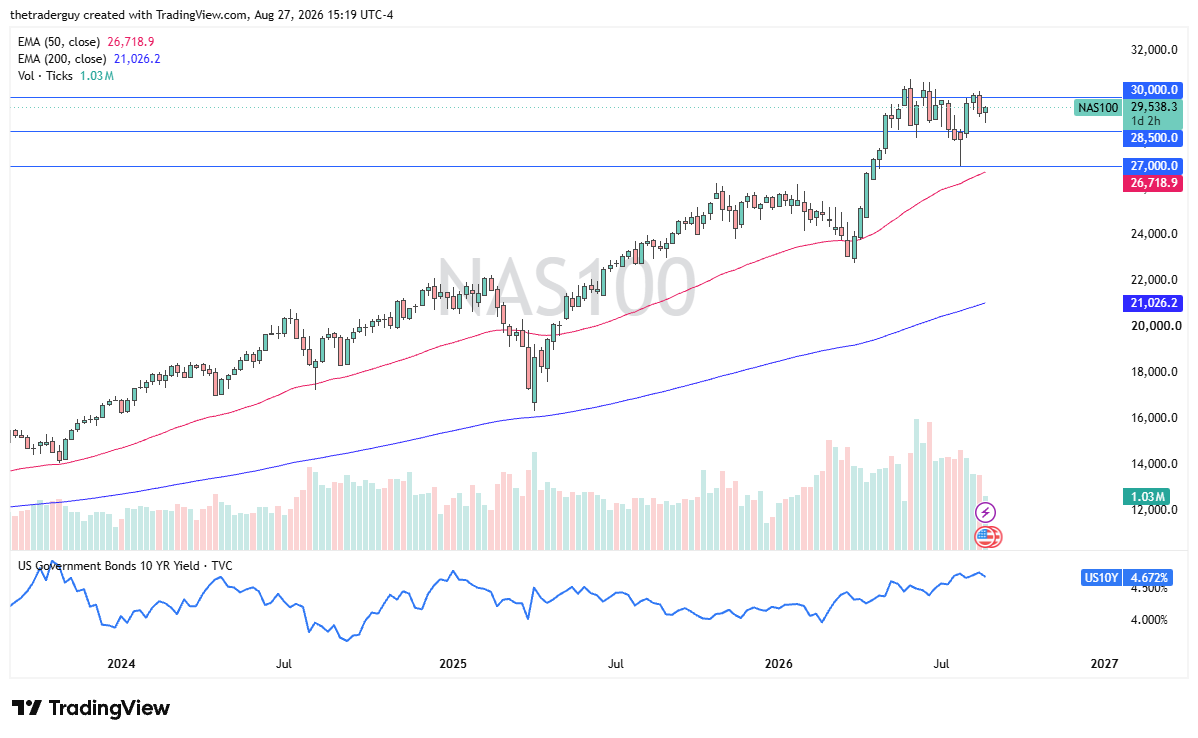
During the month of August, we've seen the NASDAQ 100 trade in a relatively tight range, but as we head into September, there are a lot of moving pieces to deal with. The range in August was as low as 27,000 for a very short amount of time, and the 30,000 level to the upside. Ultimately, we spent a bulk of that time between 28,400 and 30,000, and it does look like we're trying to break out to the upside. If we do, we could see another leg higher, especially if accompanied by good news out of the Middle East or the US/Canada situation.
When you look at the longer-term chart, we certainly have been very bullish, but the last couple of months have been choppy and sloppy trading after the shot higher in the earlier part of the year starting at the end of March. All things being equal, this is a market that looks like it is forming some type of bullish flag, and if we are patient enough, we could see this market break out. From a purely technical analysis standpoint, I feel pretty confident in that momentum and trend. However, there is always more to think about in the stock markets.
Bullish Flag Pattern and Geopolitical Risks
However, we also have to worry about situational problems, such as the Persian Gulf standoff, and what that could do to energy inflation and, by extension, Federal Reserve policy. This will continue to be a major factor in risk appetite, but it also seems to be something that market participants are willing to make excuses for, given enough time. This has been the way we have behaved for quite some time.
Earnings season has been okay, and most importantly, Nvidia came out pretty good, so that helps the NASDAQ 100 as well. So really, at the end of the day, this looks like a market that's trying to find a reason to rally. If and when it gets it remains to be seen, but there's nothing on this chart that even remotely tells me that I want to short this market. This is a ‘long only’ market at the moment, and with the way that it is constructed, it is normal for that matter.
Ready to trade our monthly forecast? We’ve made this stocks brokers list for you to check out.