


Top Regulated Brokers
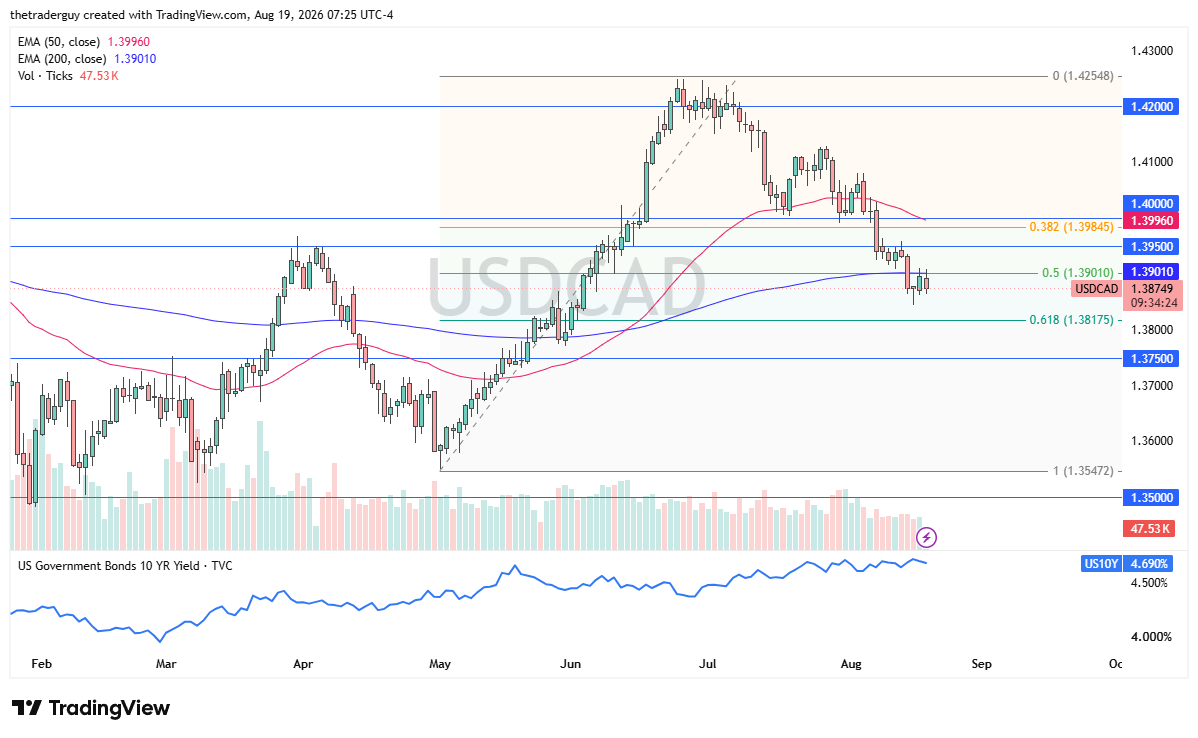
USD/CAD consolidation at the golden zone hinges on a sharp divergence between dovish Fed repricing and latent safe-haven demand that could trigger a sudden reversal. The pair is testing a structural inflection point within the 50% to 61.8% Fibonacci retracement band where institutional positioning typically fractures into directional commitment. This standoff exposes a vulnerability: consensus leans toward USD weakness, yet thin liquidity in a seasonally quiet period masks the risk of impulsive reversals if geopolitical events or US data surprise.
The Current Consolidation Setup
The USD/CAD consolidation reflects the market's struggle to price two competing forces simultaneously. Stronger Canadian economic data and a sharp repricing of Fed rate expectations lower have accelerated selling pressure in the US dollar. Yet geopolitical tensions and flight-to-safety flows introduce a counter-narrative: if risk sentiment deteriorates or if the Fed's dovish pivot loses credibility, the dollar could reclaim its safe-haven premium. The pair's position near the golden zone bracketed by the 50% and 61.8% Fibonacci retracement levels indicates the market is at a structural turning point where conviction typically crystallizes.
Understanding the Fed's Policy Shift
The Federal Reserve's recent communication signals a policy pause that hinges on incoming data rather than a predetermined cutting cycle. Current FedWatch probabilities suggest a hold at the December meeting, a sharp divergence from market pricing two months ago that priced two additional cuts through year-end. This repricing drags the dollar lower as real yields compress. Simultaneously, Canadian economic data (jobs growth and inflation surprises) have diverged upward, introducing an asymmetry: the Bank of Canada faces less urgency to cut, while the Fed's patience is exhausting. This divergence is structural, not cyclical, and it suggests the near-term bias favors USD weakness unless US data abruptly reverses.
Technical Levels and the Fibonacci Foundation
Multiple institutional anchors converge at the golden zone, creating a structural bottleneck for institutional positioning. The 50% Fibonacci retracement converges with the 200-day exponential moving average near current price action, while the 61.8% level (the market's classical golden ratio) sits approximately 75 to 100 pips lower depending on intraday volatility. This confluence is not arbitrary; it signals where large traders typically transition from consolidation to commitment. Historically, bounces from the 50% level have printed mild reversals higher before rolling over, but the macro backdrops of Fed repricing, BoC caution, and geopolitical unease has shifted the gravitational center downward. A decisive daily close above the 200-day EMA would challenge this bias; a rejection at the 61.8% would reinforce it.
USD/CAD Price Chart
The Geopolitical Wildcard
Geopolitical tension introduces a second-order feedback loop that complicates the dovish USD narrative. If institutional capital flows retreat from risk assets such as equities, emerging markets, and commodity-linked currencies, USD/CAD would typically weaken as the Canadian dollar sheds its risk premium. However, if geopolitical escalation triggers broad de-risking that extends beyond the Middle East, the dollar's safe-haven status could reassert, inverting the current consolidation bias. This scenario masks a vulnerability in consensus positioning: traders are lean USD, assuming geopolitical tensions remain contained. A sudden escalation would force rapid repricing and could trap stretched short-dollar positions. The current price action suggests the market has priced a middle scenario - geopolitical unease without systemic de-risking - leaving exposure to both upside and downside shocks.
Seasonal Liquidity Considerations
The seasonally quiet period between now and year-end creates a structural friction in price discovery. Reduced institutional participation masks sudden reversals around key levels; moves that would normally absorb into large bid-ask spreads instead cascade into impulsive swings. USD/CAD is particularly susceptible because it connects equities, fixed income, and commodity flows: if one axis unwinds, the others follow. A seemingly modest catalyst such as a headline risk escalation, a softer-than-expected US print, or even a technical bounce at the 50% Fibonacci level, could trigger outsized movement in thin conditions. This suggests two risks: first, that a directional breakout around the golden zone may lack follow-through once institutional volume returns; second, that the consolidation itself could be shattered by a single shock that moves through thin order books. Traders monitoring this pair should watch for volume patterns during the North American open, where institutional participation is most visible.
My Take on USD/CAD Now
USD/CAD consolidation at the golden zone reflects a structural standoff between dovish Fed repricing, latent safe-haven demand, and seasonally thin liquidity that exaggerates directional moves. The technical setup has narrowed toward a critical inflection point where the 50% and 61.8% Fibonacci retracements converge with the 200-day moving average, creating a bottleneck that typically precedes institutional commitment. Impulsivity during the North American session, when order-flow visibility is usually highest, may reveal which direction the pair intends to break. Watch for a sustained move above the 200-day EMA to signal renewed USD strength, or a rejection at the 61.8% level to reinforce downside conviction.
Ready to trade our USD/CAD analysis? Here is our list of the top 10 brokers worth reviewing.