


Top Regulated Brokers
This pair gained ground on Friday, attempting to reverse steep declines earlier this week driven by a stronger Greenback following the Federal Reserve lifting interest rates for the first time since July 2023 and paving the way for further hikes. The Fed’s recent pivot to more hawkish monetary policy on the back of stubbornly high inflation creates uncertainty about the future direction of the AUD/USD, despite the Reserve Bank of Australia (RBA) also expected to increase rates later this month.
Why AUD/USD Is Caught Between the Fed and RBA
The pair’s latest move lower came on Wednesday after the Fed increased its benchmark interest rate to the 3.75% to 4.00% range and flagged increasing borrowing costs in the months ahead as the central bank attempts to combat persistent inflationary pressures, in part caused by higher energy prices tied to the Middle East conflict. The Fed’s closely watched policy statement and economic projections show one further rate rise this year and ending 2027 at the same level.
While the Fed’s recent pivot to more hawkish monetary policy has boosted appetite for the Greenback and consequently pressured the Australian dollar, the prospect for further RBA rate hikes may underpin the currency. Market participants expect the central bank to raise the domestic interest rate to 4.60% later this month, with some economists and traders anticipating three more rate rises in the coming months as inflation remains well above the RBA’s 2% target. Earlier today, RBA governor Michele Bullock told a parliamentary committee in Canberra that inflation risks were starting to materialize, possibly placing a short-term tailwind behind the AUD/USD.
AUD/USD Price Action Shows the Selloff May Be Losing Momentum
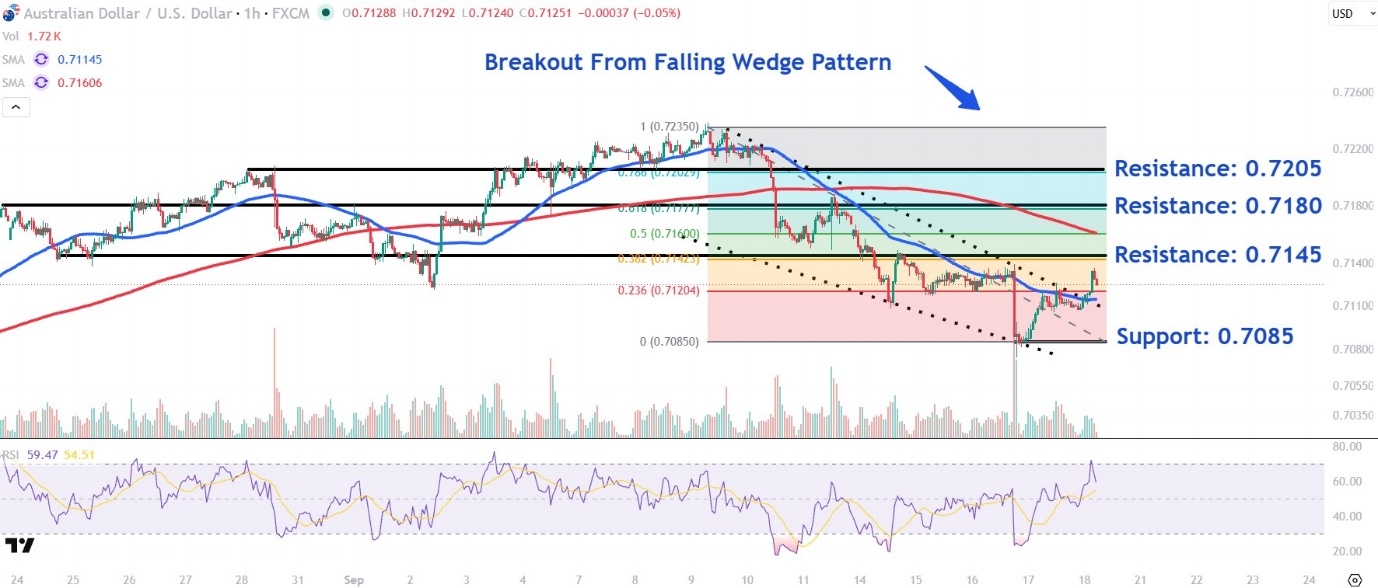
Since topping out earlier this month, the pair has trended lower within a falling wedge, a chart pattern that signals a potential bullish reversal upon a breakout above the formation’s upper trendline. Indeed, the price has broken above the pattern and downward sloping 50 moving average in early trade on Friday, favoring further bullish price action. It’s also worth noting that the relative strength index (RSI) has climbed toward overbought territory, indicating improving momentum.
AUD/USD Price Chart
Key AUD/USD Levels That May Test the Emerging Recovery
An initial breakout above the falling wedge could see the pair climb to around 0.7145. This location roughly aligns with the closely-watched 38.2% Fibonacci retracement level and a horizontal line that connects several peaks and troughs on the chart stretching back to the August 24 swing low.
Buying above this level may trigger a move toward the 61.8% Fibonacci retracement level around 0.7180. Traders who have opened long positions at lower prices could look for profit-taking opportunities in this area near the prominent August 21 and September 11 peaks.
A decisive close above this level would open the door for the price to retest the 0.7205 level. This location finds a confluence of overhead resistance near the 78.6% Fibonacci retracement level and a trendline linking a series of corresponding price action on the chart between late August and early September.
The AUD/USD Support Area That Keeps the Recovery Intact
Renewed selling could see the pair retest its recent low around 0.7085. Buyers may step up to the plate in this location near the start of the Fibonacci grid and the falling wedge pattern’s lower trendline.
What Could Strengthen or Weaken the AUD/USD Recovery Case
While the Greenback remains well supported driven by the Fed’s recent hawkish policy pivot, the technicals indicate the AUD/USD’s recent retracement may be nearing its competition. Friday’s chart breakout above a falling wedge pattern aligns with growing expectations for up to three more domestic rate hikes in coming months.
Sources:
https://www.reuters.com/world/asia-pacific/dollar-girded-by-bets-us-hiking-cycle-2026-09-16/
Ready to trade our analysis of the AUD/USD? Here is our list of the best Forex brokers worth checking out.