


Bullish view
Buy the EUR/USD pair and set a take-profit at 1.1625.
Add a stop-loss at 1.1485.
Timeline: 1-2 days.
Bearish view
Sell the EUR/USD pair and set a take-profit at 1.1485.
Add a stop-loss at 1.1625.
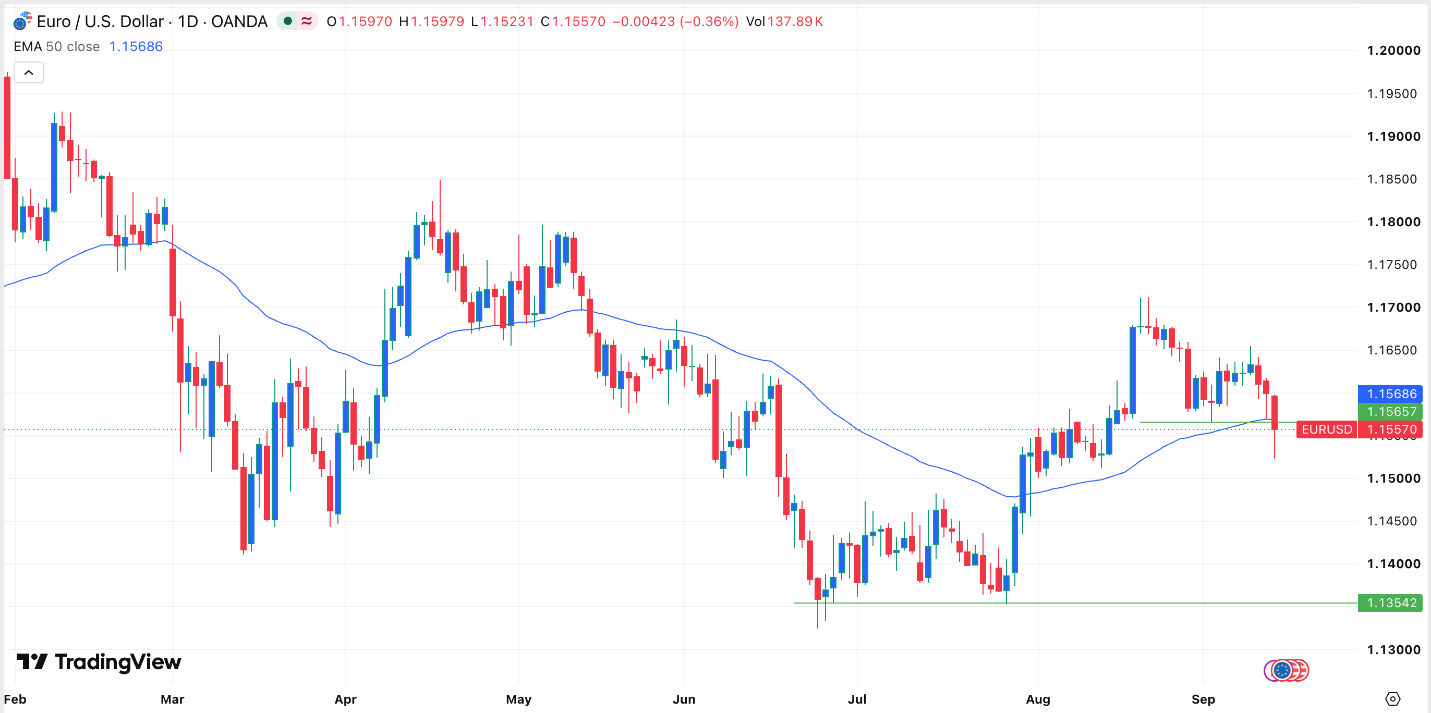
EUR/USD slipped for three consecutive days as US bond yields and crude oil prices continued their strong uptrend. It dropped to 1.1524, its lowest level since August 13 as focus shifts to the upcoming Federal Reserve interest rate decision.
Top Regulated Brokers
US Dollar Jumps as Geopolitical Risks Remain
The EUR/USD pair retreated as investors focused on several major events happening in the market. One of the key events is that the ten-year bond yield jumped for eight consecutive days, reaching its highest level since 2007. This is an important metric because it is used as a lending benchmark for most assets.
US bond yields are soaring as investors react to the rising US public debt and the fact that the economy is slowing. They are also rising as energy prices continue to rise, with the average gasoline and diesel prices rising to $4.31 and $6.23, respectively.
The rising oil prices will lead to higher inflation in the country. Data released last week showed that the headline and core consumer inflation rose 3.4% and 2.4%, respectively. These metrics mean that inflation has remained above the 2% level for over five years.
Therefore, there is a likelihood that the Federal Reserve will hike interest rates tomorrow. The CME Fed Futures tool places the odds of a rate hike at over 80%. A rate hike will come a week after the European Central Bank (ECB) decided to hike interest rates, with officials hinting that another hike will be possible.
The EUR/USD pair will also react to the upcoming French and Italian consumer inflation data later today. These numbers come a day before Eurostat releases the official European consumer inflation report. While important, these numbers will not have a major impact on ECB since Eurostat has already published the preliminary inflation data.
EUR/USD Technical Analysis
The daily chart shows that the EUR/USD pair has pulled back in the past few days. This sell-off continued after the ECB delivered its interest rate decision, which was in line with expectations.
The pair has moved slightly below the key support level of 1.1565, its lowest level on September 2nd this year. It remains below the 50-day moving average. On the positive side, it has formed a hammer candlestick pattern, which is made up of a body and a long lower shadow. This pattern often leads to a bullish breakout.
Therefore, the pair will likely have a relief rally as investors buy the dip. If this happens, the pair will retest the resistance at 1.1600 and then resume the downward trend.
Ready to trade our daily Forex signal? Check out the best forex brokers in Europe worth using