


Top Regulated Brokers
This week is the “quiet week” after the “big and noisy” previous week, or so it seems. There are no truly high-impact economic data releases or other scheduled events that are likely to move the GBP/USD currency pair. Having said that, if you’ve been watching price charts over the past few days, you will have seen that although moves are not especially large, the market is moving healthily with a directional bias, and this is a combination that can make for profitable times for traders.
Why the US Dollar Is Driving GBP/USD Lower
The main reason why now is a good time to be interested in the Forex market, and in this currency pair in particular, is that the US Dollar has finally started moving in a more steady way – upwards. When the US Dollar is at the centre of market action, it often indicates a more reliable trend. In just the last few days and weeks, we have seen the Dollar become the currency that has serious strength, even as risk appetite remains somewhat strong. This comes after a long period of Dollar consolidation lasting well over one year, and breakouts that come after very long-term consolidation patterns are often powerful – although the technical breakout is in the DXY (US Dollar Index), not the GBP/USD.
Another reason why this seems to be an important moment for the US Dollar is the increasing expectation that the Federal Reserve will make two further rate hikes by the end of 2026, at about a 55% probability. The US 10-Year Treasury Yield is currently trading above 5.12%.
GBP/USD Price Action Shows a Bearish Market Structure
The price has continued to trade lower, and in recent hours has fallen to a new near two-month low. The hourly price chart shows a dominant bearish descending price channel evidenced by the two-week linear regression analysis, which is not perfectly symmetrical but enough to be significant. A bearish sign is the breakdown below the low of that study.
The price action is very bearish, with the price action yesterday invalidating a couple of support levels, and printing new clear resistance levels at 1.3266 and 1.3294. The nearest support level at 1.3202 is very confluent with the round number at 1.3200 and so might have some strength in it.
A Long-Term Support Zone Comes Into Focus
Zooming out to a longer-term price chart like the daily, we can see that the price has spent recent weeks moving down from a failed bullish breakout near its very long-term upper resistant boundary at about 1.3650. The 1.3100 area has tended to be the (less clear) lower boundary of that dominant range, and now we are close to 1.3200, the prospect of testing long-term lows comes into view.
The area between 1.3140 and 1.3160 represents a one-year double bottom, so if the price gets below that, it will truly be trading in blue sky. Alternatively, we might see a bullish reversal or at least a major retracement.
Looking at the very short-term picture, we are seeing what might be a rapid bullish head and shoulders pattern printed within just a few hours, and this suggests we might start the London session with a bullish retracement.
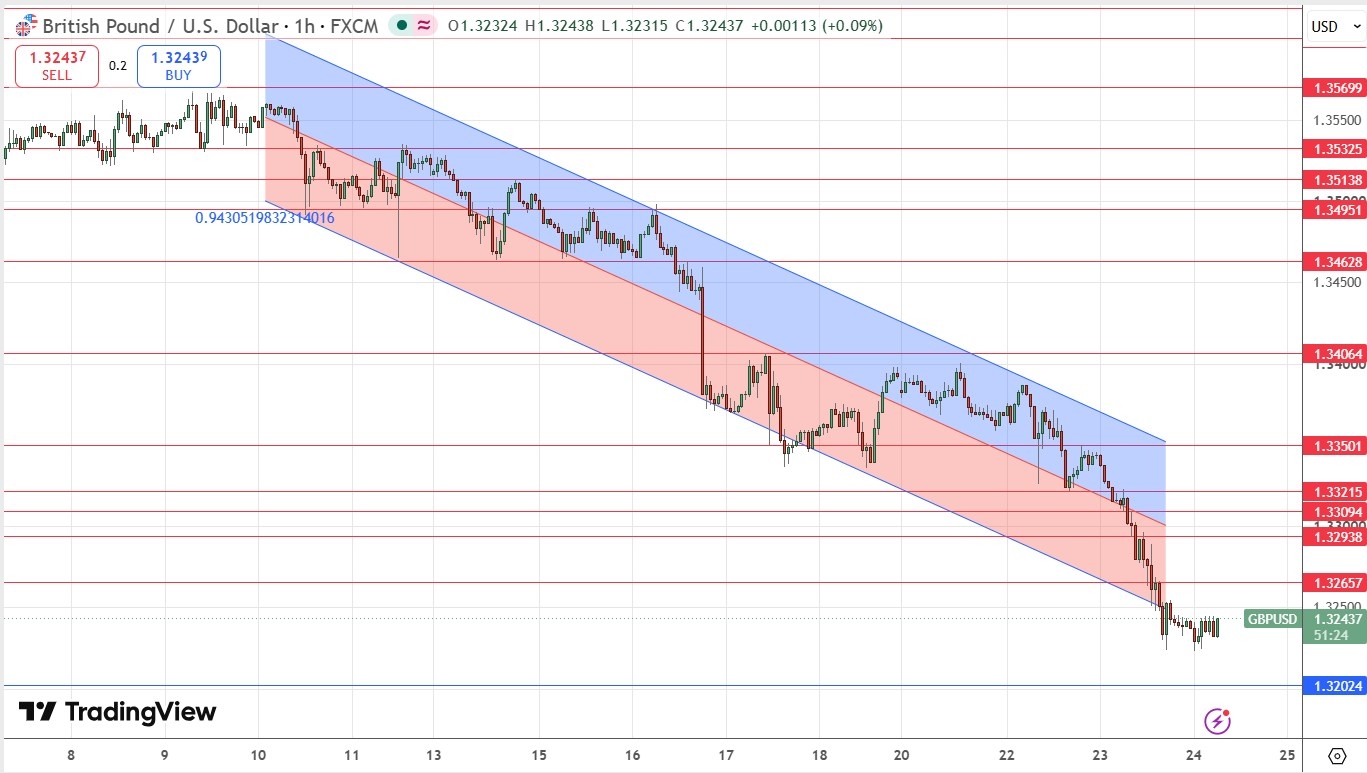
GBP/USD H1 Price Chart Suggesting Short-Term Bullish Pullback
GBP/USD Faces a US Data Reality Check
The blind spot for GBP/USD this week may be the assumption that the pound’s domestic story remains the decisive driver. Sterling still has support from persistent UK inflation and a Bank of England that is reluctant to signal rapid easing, but that support could prove fragile if incoming US data again point to resilient demand and inflation pressures that are slow to fade. The key risk is not necessarily an overtly hawkish Federal Reserve signal; it is that labour-market, spending or inflation-related releases reinforce the idea that US interest rates may need to remain restrictive for longer than markets expect. That would give the dollar renewed support, even without a major shift in UK expectations. A market positioned for the BoE to underpin GBP/USD could therefore be vulnerable to a more subtle repricing: not a collapse in sterling confidence, but a reassessment of how much easing the Fed can realistically deliver.
H2 Resistance Levels That Could Challenge the Bearish View
At what point does the outlook become bullish? We can spot a very obvious level quickly, which has a confluence of horizontal flipped support to resistance, a half number, and the likely position of the upper edge of the bearish linear regression analysis structure – 1.3350. However, the price might struggle to get there. Yet if it does, this could be an excellent opportunity for a short swing trade entry.
Below that, what stands out the most is the resistant zone between 1.3294 and 1.3309, which is obviously confluent with the round number at 1.3300. If the price gets established above this small zone, it would be a more minor but significant bullish sign.
Ready to trade our GBP/USD analysis? Here is our list of the best Forex brokers worth checking out.