


Markets are starting to see a minor but real recovery in risk sentiment this week, although it is very unclear as to whether it will hold. Risk sentiment can have a major impact upon the behaviour of this currency pair. This is putting the AUD/USD currency pair in focus, as well as interesting technical development we have just seen in the price chart. Let’s look at the two currencies first.
Top Regulated Brokers
AUD/USD Fundamental Analysis
The Australian Dollar has a cautiously bullish fundamental outlook, supported by a hawkish Reserve Bank of Australia and stronger-than-expected Chinese growth. Persistent inflation is keeping further Australian rate increases in play, supporting the currency, while improving Chinese activity strengthens demand for Australian commodity exports. However, a softening domestic labour market could temper the RBA’s willingness to tighten further, limiting the Aussie’s upside. Australia’s third-quarter inflation release due on 28th October is the next key catalyst: an upside surprise would reinforce rate-hike expectations and support AUD, whereas a softer reading could undermine its recent recovery.
The US Dollar has a mixed fundamental outlook, with persistent inflation providing underlying support but fading expectations of an imminent Federal Reserve rate hike weighing on near-term momentum. Higher energy prices and resilient US consumer spending could keep monetary policy restrictive, sustaining the appeal of dollar-denominated assets; however, other central banks are also tightening, limiting the dollar’s relative interest-rate advantage. Markets have recently scaled back expectations of an October hike despite firm inflation readings, leaving the currency sensitive to incoming economic data. Stronger inflation or activity figures would support renewed dollar gains, while softer readings would reinforce expectations of a Fed pause and leave it vulnerable ahead of the October 27–28 meeting.
It looks like fundamentals are moving towards supporting a more bullish case in this currency pair.
AUD/USD Technical Analysis
The price chart below shows as its most defined feature a double bottom at the round number of 0.6900 which has printed over the month of October and has just completed. The price has broken through resistance and is approaching another key resistance level just above the big round number at 0.7000 – 0.7010.
The price has been moving higher with relatively strong momentum, and it looks likely to require a break when it gets to 0.7000, where it looks likely to consolidate under the resistance for a while/
Right now might be a bit early or late to look for a trade. I doubt the price is ready to break out, and in the absence of any high-impact data releases scheduled for today, there probably won’t be enough trigger to drive that. A short trade from a few hours rejecting the area of resistance from 0.7000 to 0.7010 is the most likely setup, and this could work well if risk sentiment turns more sour after the New York open.
It is worth noting that if we do get a bearish rejection at 0.7011 there will be a double top to compete with the double bottom we have already seen at 0.6900, which would make this whole area between 0.6900 and 0.7011 a well-defined range.
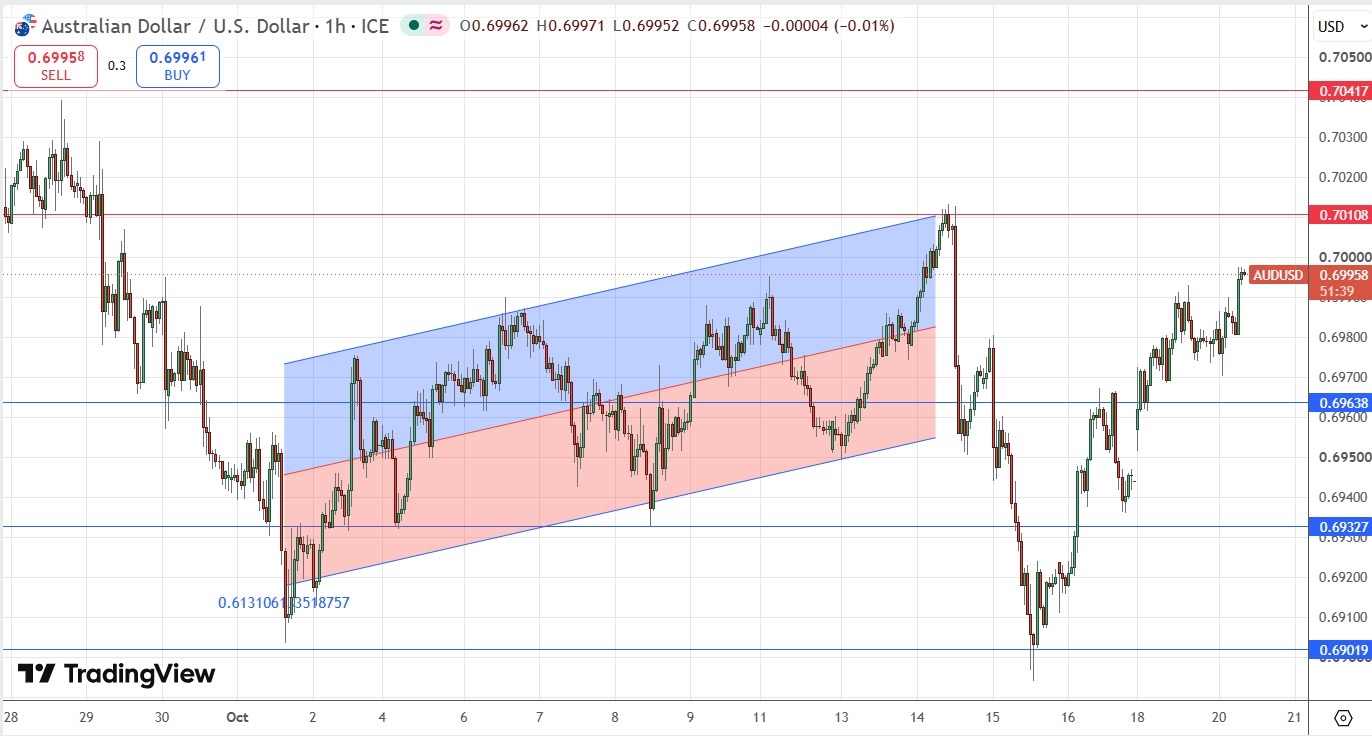
AUD/USD H1 Price Chart – Double Bottom, Double Top?
Support & Resistance Levels
My previous AUD/USD signal on 15th October was not triggered, as unfortunately the low was a few pips below $0.6907.
Risk 0.25%.
Trades may only be entered prior to 5pm Tokyo time Wednesday.
Short Trade Idea
Short entry following a bearish price action reversal on the H1 time frame immediately upon the next touch of $0.7011 or $0.7042.
Place the stop loss 1 pip above the local swing high.
Adjust the stop loss to break even once the trade is 20 pips in profit.
Take off 50% of the position as profit when the price reaches 20 pips in profit and leave the remainder of the position to ride.
Long Trade Ideas
Long entry following a bullish price action reversal on the 1H1 time frame H1H1H1 time frame immediately upon the next touch of $0.6964 or $0.6933.
Put the stop loss 1 pip below the local swing low.
Move the stop loss to break even once the trade is 20 pips in profit.
Remove 50% of the position as profit when the price reaches 20 pips in profit and leave the remainder of the position to ride.
The best method to identify a classic “price action reversal” is for an hourly candle to close, such as a pin bar, a doji, an outside or even just an engulfing candle with a higher close. You can exploit these levels or zones by watching the price action that occurs at the given levels.
There is nothing of high importance scheduled today regarding either the Australian or US Dollars.
Ready to trade our daily Forex signals? Here is our list of the best Forex brokers worth checking out.